- Ethereum price failed to surpass $3,000 and started a fresh decline against the US Dollar.
- ETH price is now trading below $2,600 and the 55 simple moving average (4-hours).
- There was a break below a key bullish trend line with support near $2,780 on the 4-hours chart (data feed from Coinbase).
- The pair is likely to continue lower towards $2,300 or even $2,000 in the near term.
Ethereum price is slowly moving lower below $2,500 against the US Dollar. ETH/USD could extend losses as long as it is below the $2,600 support zone.
Ethereum Price Analysis
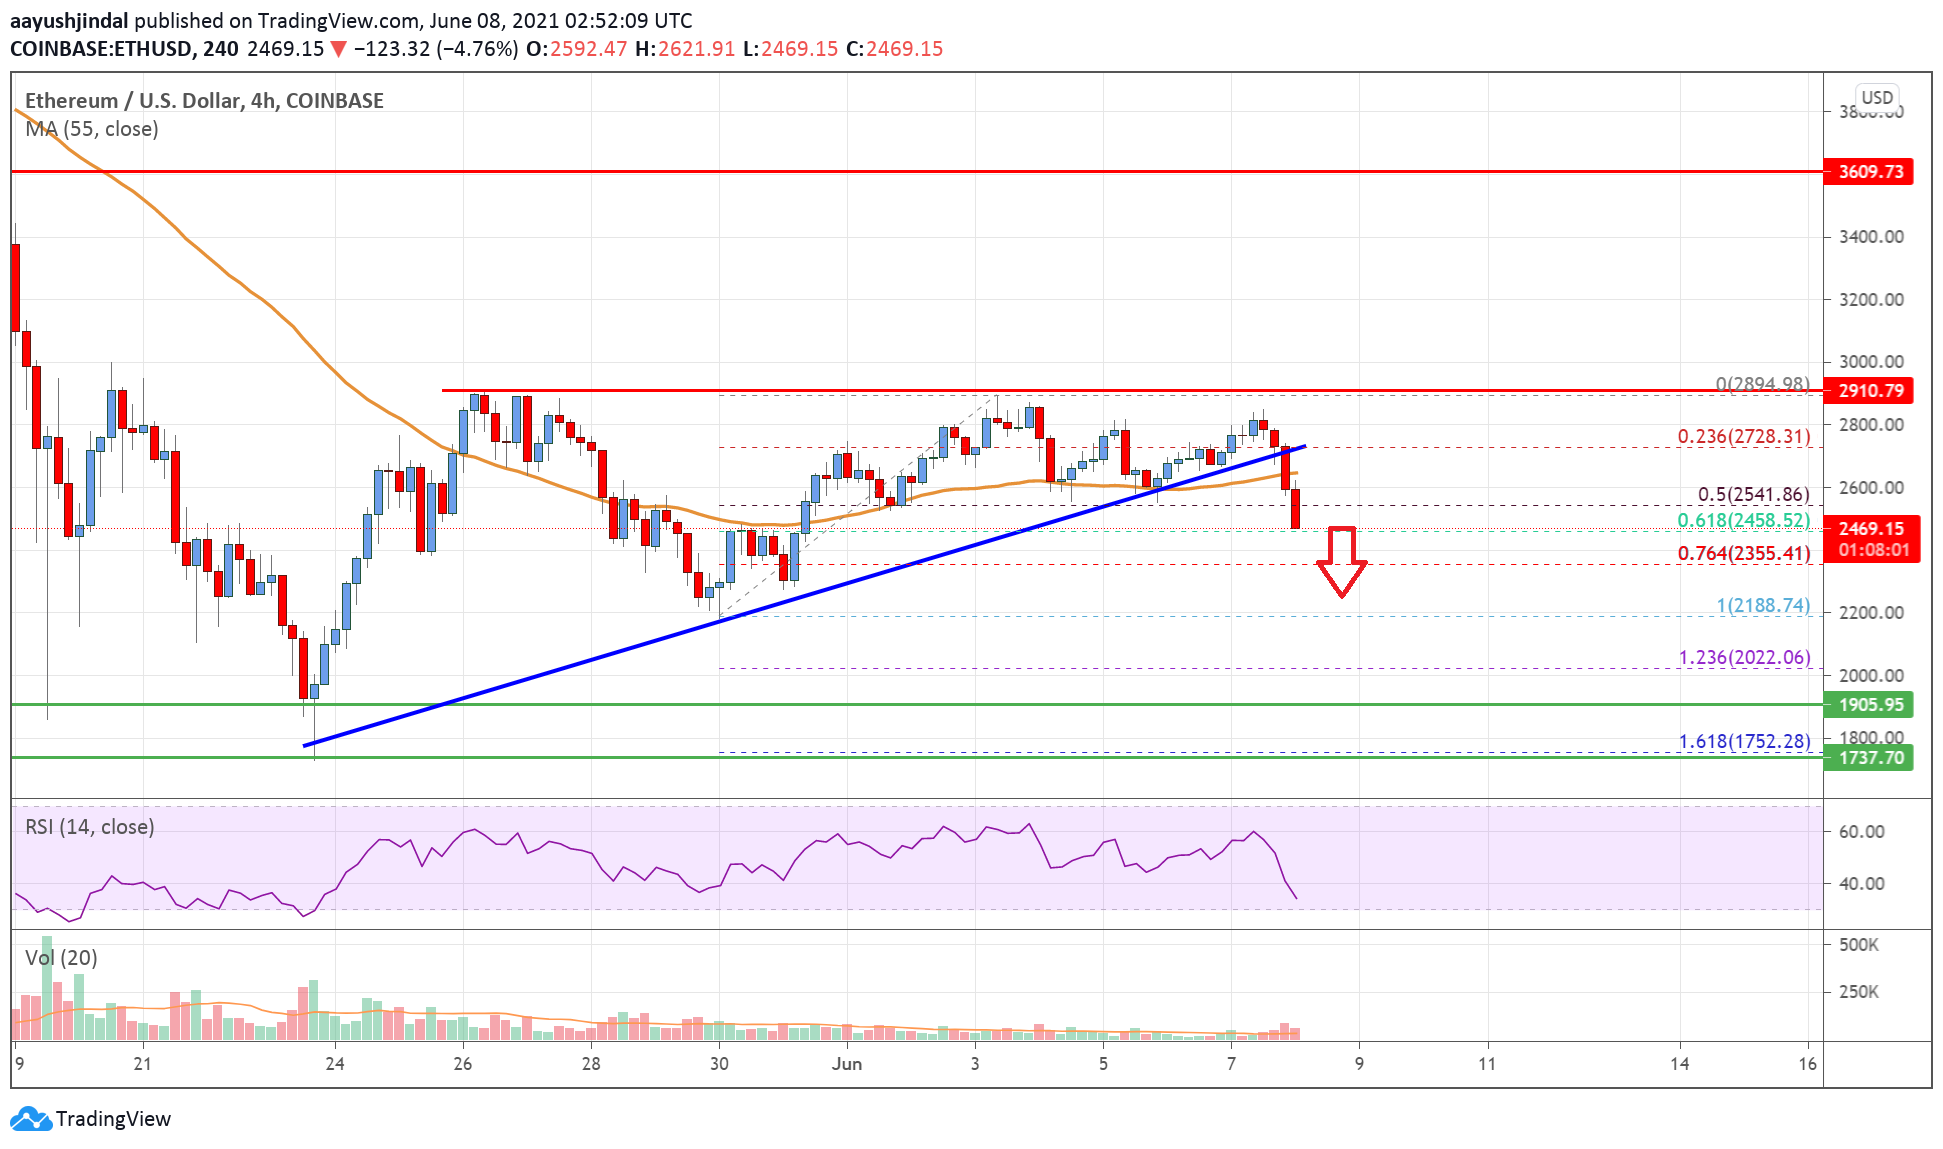
Recently, ethereum made a few attempts to gain pace above $2,800 and $2,850 against the US Dollar. However, ETH failed to continue higher and started a fresh decline below $2,750.
There was a break below the $2,700 and $2,650 support levels. The bears were able to push the price below $2,600 and the 55 simple moving average (4-hours). There was also a break below a key bullish trend line with support near $2,780 on the 4-hours chart.
The pair is now trading below the 50% Fib retracement level of the upward move from the $2,188 swing low to $2,894 high.
An immediate support on the downside is near the $2,480 level. It is close to the 61.8% retracement level of the upward move from the $2,188 swing low to $2,894 high. The next major support is near the $2,300 level. Any more losses could set the pace for a drop towards the $2,000 support zone in the near term.
An immediate resistance on the upside is near the $2,580 level. The next major resistance is near the $2,620 level and the 55 simple moving average (4-hours). A clear break above the $2,620 zone could start a strong increase. In the stated case, the price could revisit the $2,800 resistance zone.

Looking at the chart, Ethereum price is clearly trading well below the $2,600 level and the 55 simple moving average (4-hours). Overall, ether price is likely to continue lower towards $2,300 or even $2,000 in the near term.
Technical indicators
4 hours MACD – The MACD for ETH/USD is gaining momentum in the bearish zone.
4 hours RSI (Relative Strength Index) – The RSI for ETH/USD is now well below the 50 level.
Key Support Levels – $2,300, followed by the $2,000 zone.
Key Resistance Levels – $2,620 and $2,800.


Leave a Reply
You must be logged in to post a comment.