- ADA price started a fresh decline after it failed to surpass $2.0 against the US Dollar.
- The price is now trading well below the $1.65 zone and the 55 simple moving average (4-hours).
- There was a break below a key bullish trend line with support near $1.68 on the 4-hours chart (data feed via Bitfinex).
- The price is declining and it could even slide further below $1.40 in the coming sessions.
Cardano price is struggling to hold gains above $1.50 against the US Dollar, similar to bitcoin. ADA price remains at a risk of a sharp decline towards the $1.20 support level.
Cardano Price Analysis
This past week, cardano price made an attempt to clear the $1.90 and $2.00 resistance levels against the US Dollar. The ADA/USD pair failed to continue higher above $1.90 and started a fresh decline.
A high was formed near $1.89 before there was a drop below $1.80. There was a break below a key bullish trend line with support near $1.68 on the 4-hours chart. The pair declined below the $1.65 support level and settled well below the 55 simple moving average (4-hours).
The bears pushed the price below the 61.8% Fib retracement level of the upward move from the $1.33 swing low to $1.89 high. The price is now struggling to stay above the $1.50 support zone.
The next key support is near the $1.47 level. It is close to the 76.4% Fib retracement level of the upward move from the $1.33 swing low to $1.89 high. A clear break below $1.47 could set the pace for more losses towards the $1.35 support. The next major support could be near the $1.20 level, where the bulls are likely to take a strong stand.
An immediate resistance on the upside is near the $1.60 level. The next major resistance is near the $1.65 level and the 55 simple moving average (4-hours). A clear break above the $1.65 level could open the doors for a steady increase.
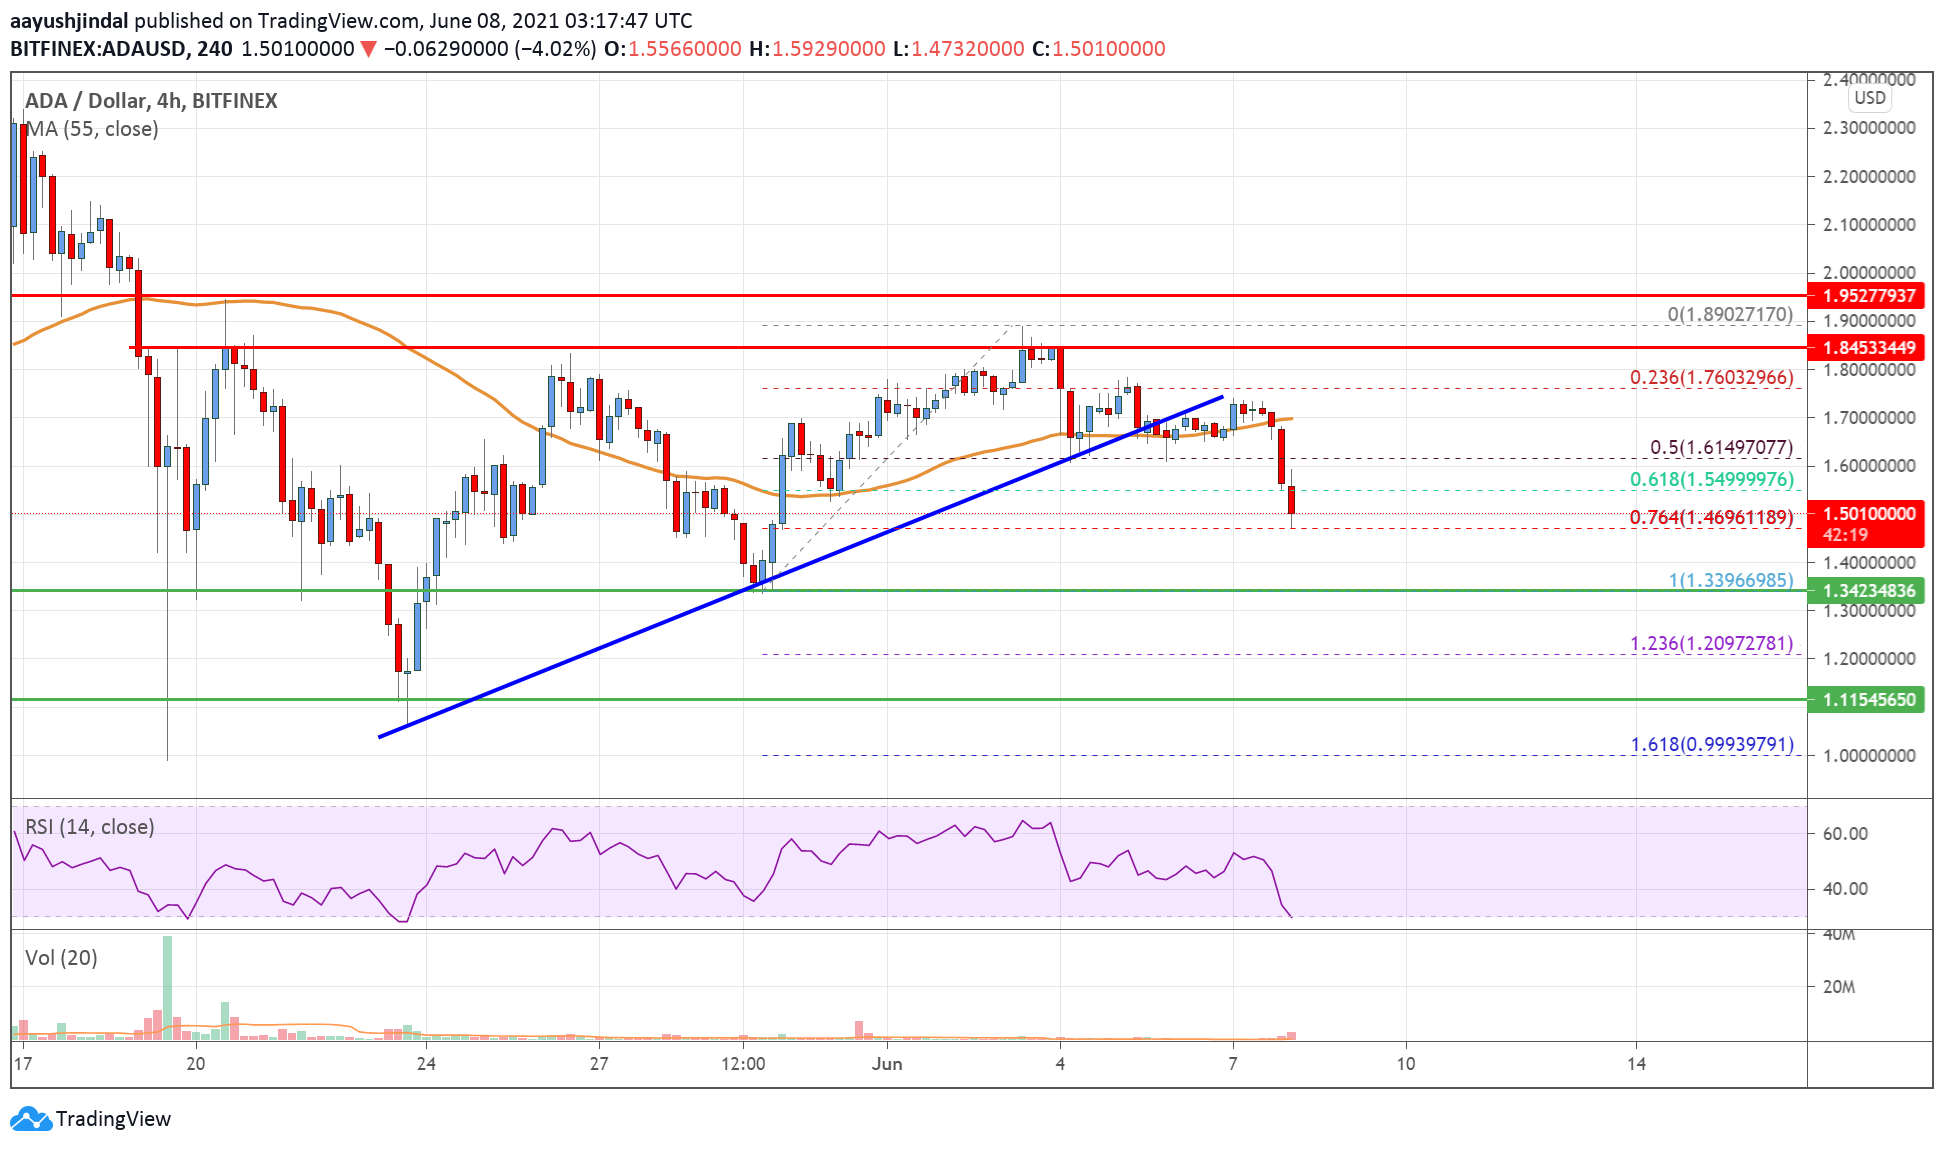
The chart indicates that ADA price is clearly trading well below $1.650 support and the 55 simple moving average (4-hours). Overall, the price is declining and it could even slide further below $1.40 in the coming sessions.
Technical Indicators
4 hours MACD – The MACD for ADA/USD is now gaining pace in the bearish zone.
4 hours RSI – The RSI for ADA/USD is now below the 50 level.
Key Support Levels – $1.47 and $1.35.
Key Resistance Levels – $1.65 and $1.80.


Leave a Reply
You must be logged in to post a comment.