
- Ethereum price topped near the $240 resistance and declined towards $200 against the US Dollar.
- ETH price is currently correcting losses, but it is facing hurdles near $215 and $216.
- There is a major bearish trend line forming with resistance near $212 on the 4-hours chart (data feed from Coinbase).
- The price remains at a risk of a strong decline if it breaks the $200 support area.
Ethereum price is trading in a downtrend below $215 and $220 against the US Dollar. ETH price might start a decent recovery as long as it is above the $200 support.
Ethereum Price Analysis
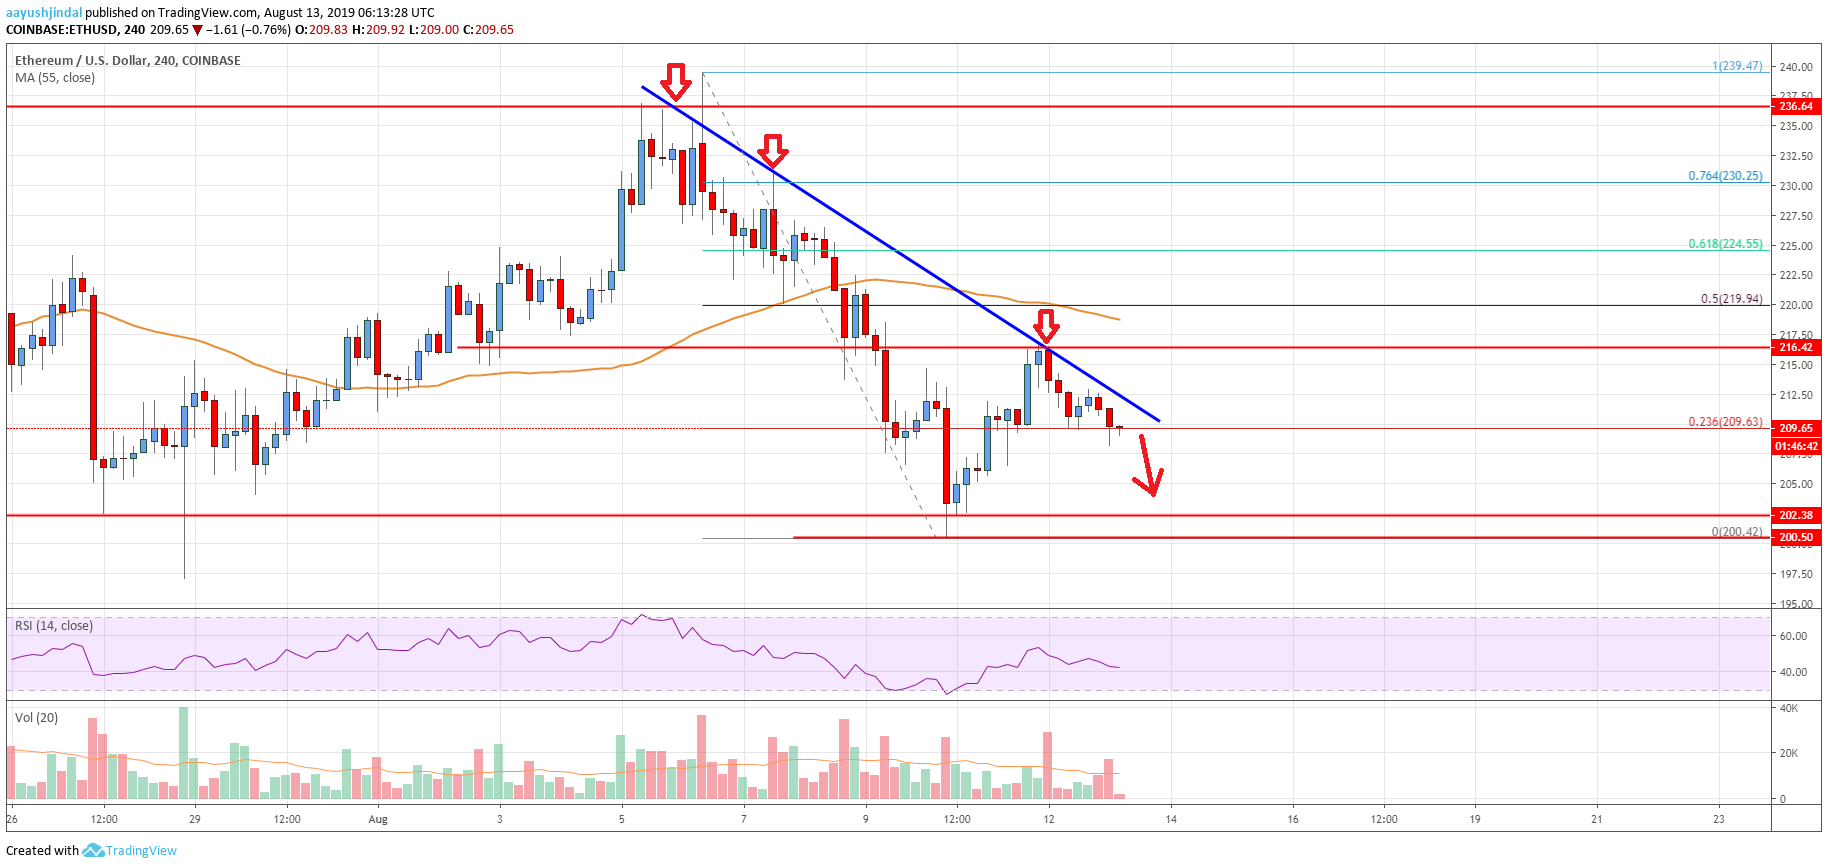
This past week, Ethereum price failed to surpass the $240 resistance against the US Dollar. The ETH/USD pair topped near the $239 level and later started a strong downward move. It broke the $230 support level to enter a bearish zone. Moreover, there was a break below the $220 support and the 55 simple moving average (4-hours). It opened the doors for more downsides below $210.
Finally, the price traded close to the $200 support area and a swing low was formed near $200. Recently, the price started an upside correction above the $210 level. Moreover, there was a break above the 23.6% Fib retracement level of the major slide from the $239 high to $200 low. However, the recovery was capped by the $215-$216 resistance area (the previous support zone).
More importantly, there is a major bearish trend line forming with resistance near $212 on the 4-hours chart. Above the trend line, the next key resistance is near the $220 level. The 50% Fib retracement level of the major slide from the $239 high to $200 low is also near the $219 level. Additionally, the 55 simple moving average (4-hours) is close to the $220 resistance area.
Therefore, the $212, $215 and $220 levels are important resistances. A successful close above $220 and the 55 SMA is needed for a fresh increase in the near term. On the downside, an immediate support is near the $205 level. The main supports are near $200 and $202. Therefore, a bearish close below $200 might spark a significant drop in the near term.
Looking at the chart, Ethereum price is facing a couple of important hurdles near $212 and $215. If the bulls continue to struggle, there are chances of additional downsides below $205 and $200 in the coming days.
Technical indicators
4 hours MACD – The MACD for ETH/USD is still placed in the bearish zone.
4 hours RSI (Relative Strength Index) – The RSI for ETH/USD is currently well below 50, with a bearish angle.
Key Support Levels – $205, followed by the $200 zone.
Key Resistance Levels – $215 and $220.


Leave a Reply
You must be logged in to post a comment.