- Ethereum price started a fresh increase above the $1,400 zone against the US Dollar.
- ETH price is now trading below $1,500 and the 55 simple moving average (4-hours).
- There was a break below a key rising channel with support near $1,475 on the 4-hours chart (data feed from Coinbase).
- The pair could correct lower but dips might be limited below the $1,300 support zone.
Ethereum price is correcting lower below $1,500 against the US Dollar. ETH/USD could rise again if it stays above the $1,300 support zone.
Ethereum Price Analysis
This past week, ethereum saw a decent increase above the $1,200 zone against the US Dollar. ETH price was able to clear the $1,300 and $1,400 resistance levels.
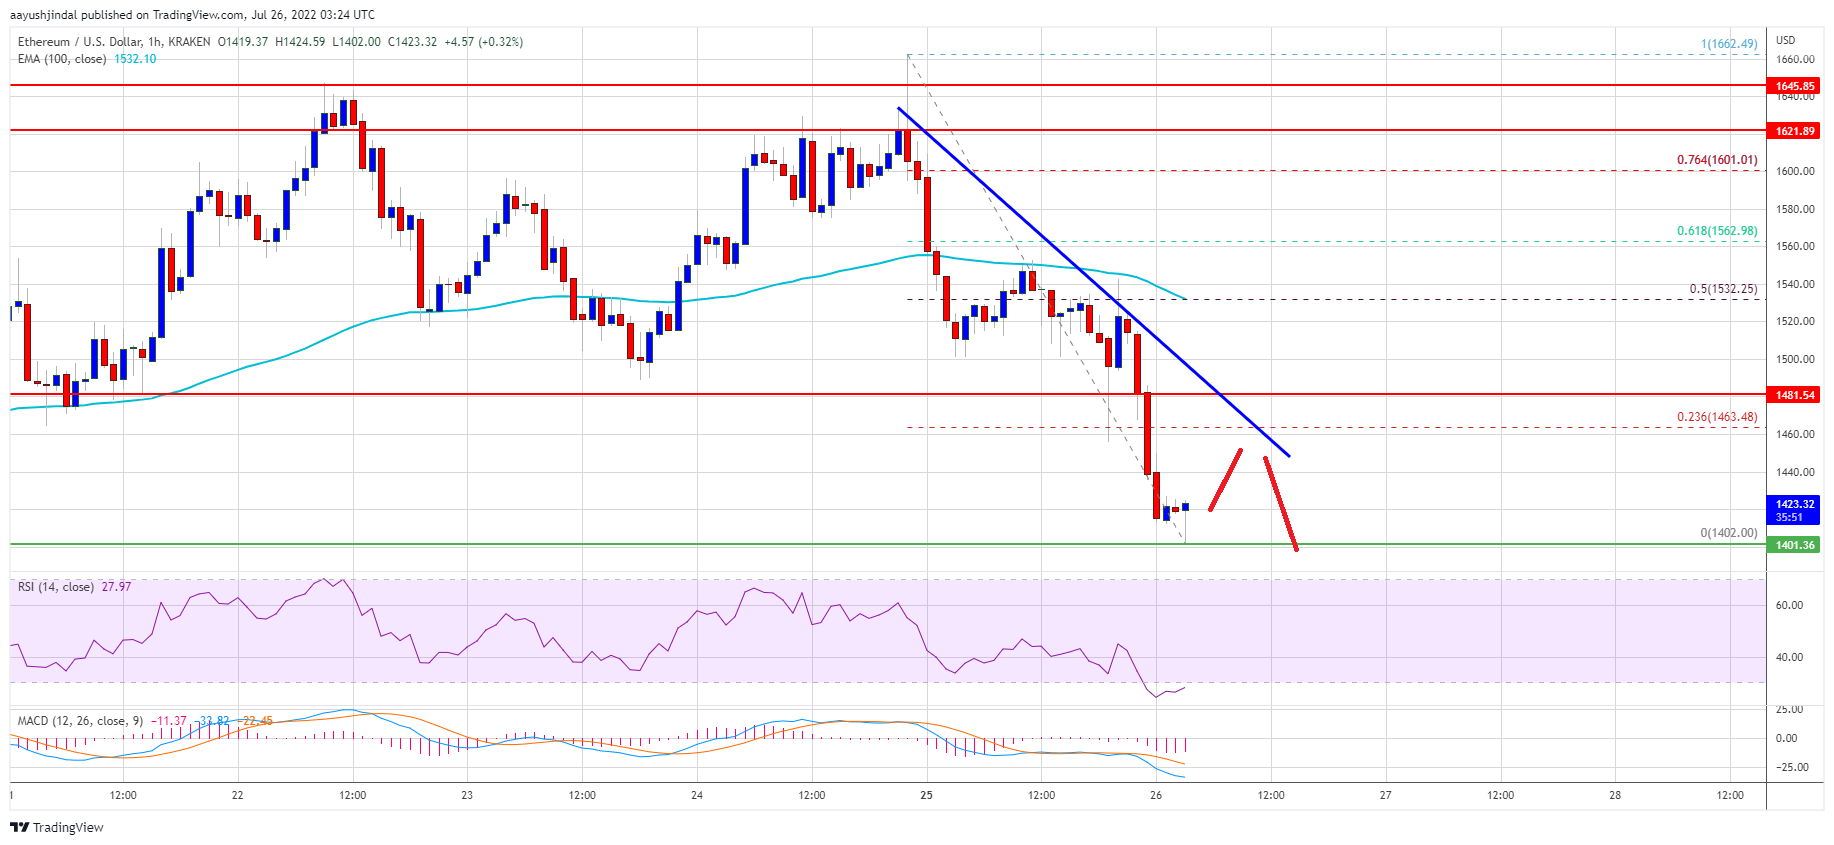
The price rallied sharply above the $1,500 and $1,550 levels. It even climbed above the $1,600 level and settled above the 55 simple moving average (4-hours). However, it formed a high near the $1,631 level and recently started a downside correction.
There was a move below the $1,550 level. The price declined below the 23.6% Fib retracement level of the upward move from the $1,005 swing low to $1,631 high.
Besides, there was a break below a key rising channel with support near $1,475 on the 4-hours chart. On the downside, an initial support is near the $1,400 level. The next major support is now near the $1,320 level. It is near the 50% Fib retracement level of the upward move from the $1,005 swing low to $1,631 high.
A break below the $1,300 support could push the price to $1,275. Any more losses could lead the price towards $1,200 or even $1,100.
An immediate resistance is near the $1,440 level. The next major resistance is near the $1,480 zone or $1,500, above which the price could rise towards the $1,580 level. Any more gains could even send the price above the $1,630 resistance zone.

Looking at the chart, Ethereum price is clearly trading below the $1,500 zone and the 55 simple moving average (4-hours). Overall, ether price could correct lower but dips might be limited below the $1,300 support zone.
Technical indicators
4 hours MACD – The MACD for ETH/USD is now gaining momentum in the bearish zone.
4 hours RSI (Relative Strength Index) – The RSI for ETH/USD is now below the 50 level.
Key Support Levels – $1,400, followed by the $1,320 zone.
Key Resistance$ Levels – $1,450 and $1,500.


Leave a Reply
You must be logged in to post a comment.