
- Ethereum price started a fresh decline from the $1,225 zone against the US Dollar.
- ETH price is now trading below $1,100 and the 55 simple moving average (4-hours).
- There was a break below a major bullish trend line with support near $1,150 on the 4-hours chart (data feed from Coinbase).
- The pair could extend losses if there is a clear move below the $1,080 support zone.
Ethereum price is struggling below $1,150 against the US Dollar. ETH/USD could gain bearish momentum if there is a close below $1,080.
Ethereum Price Analysis
This past week, ethereum saw a decent recovery wave from the $1,000 zone against the US Dollar. ETH price was able to clear the $1,100 and $1,140 resistance levels.
It even surpassed 23.6% Fib retracement level of the key drop from the $1,920 swing high to $880 low. It spiked above the $1,220 level but faced sellers near the $1,225 level. A high was formed near the $1,225 and the price started a fresh decline.
The price declined below the $1,150 and $1,100 support levels. There was a move below the 50% Fib retracement level of the upward move from the $997 swing low to $1,225 high.
Besides, there was a break below a major bullish trend line with support near $1,150 on the 4-hours chart. It is now trading below $1,100 and the 55 simple moving average (4-hours). It is also trading below the 61.8% Fib retracement level of the upward move from the $997 swing low to $1,225 high.
On the downside, an initial support is near the $1,080 level. The next major support is now near the $1,065 level. A break below the $1,065 support could push the price to $1,000. Any more losses could lead the price towards $880 or even $800.
An immediate resistance is near the $1,100 level. The next major resistance is near the $1,135 zone or $1,150, above which the price could rise towards the $1,200 level. Any more gains could even send the price above the $1,225 resistance zone.
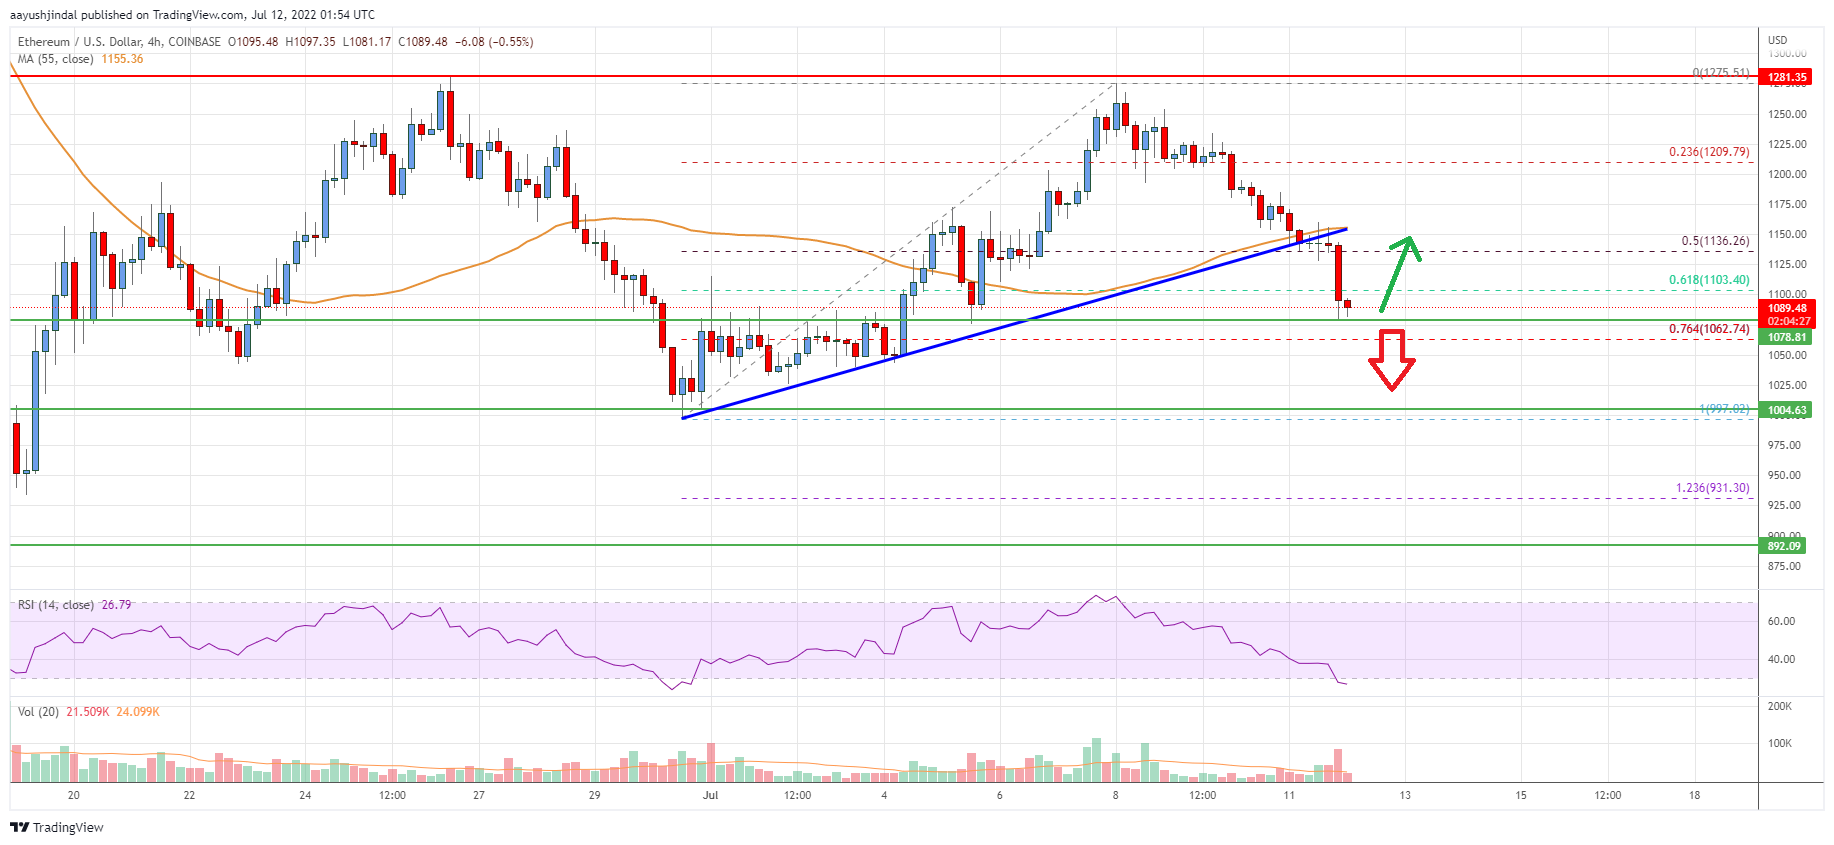
Looking at the chart, Ethereum price is clearly trading below the $1,120 zone and the 55 simple moving average (4-hours). Overall, ether price could extend losses if there is a clear move below the $1,080 support zone.
Technical indicators
4 hours MACD – The MACD for ETH/USD is now gaining momentum in the bearish zone.
4 hours RSI (Relative Strength Index) – The RSI for ETH/USD is now below the 50 level.
Key Support Levels – $1,080, followed by the $1,000 zone.
Key Resistance$ Levels – $1,135 and $1,200.


Leave a Reply
You must be logged in to post a comment.