
- Ethereum price started a fresh decline from the $4,200 resistance against the US Dollar.
- ETH price is now trading below $4,000 and near the 55 simple moving average (4-hours).
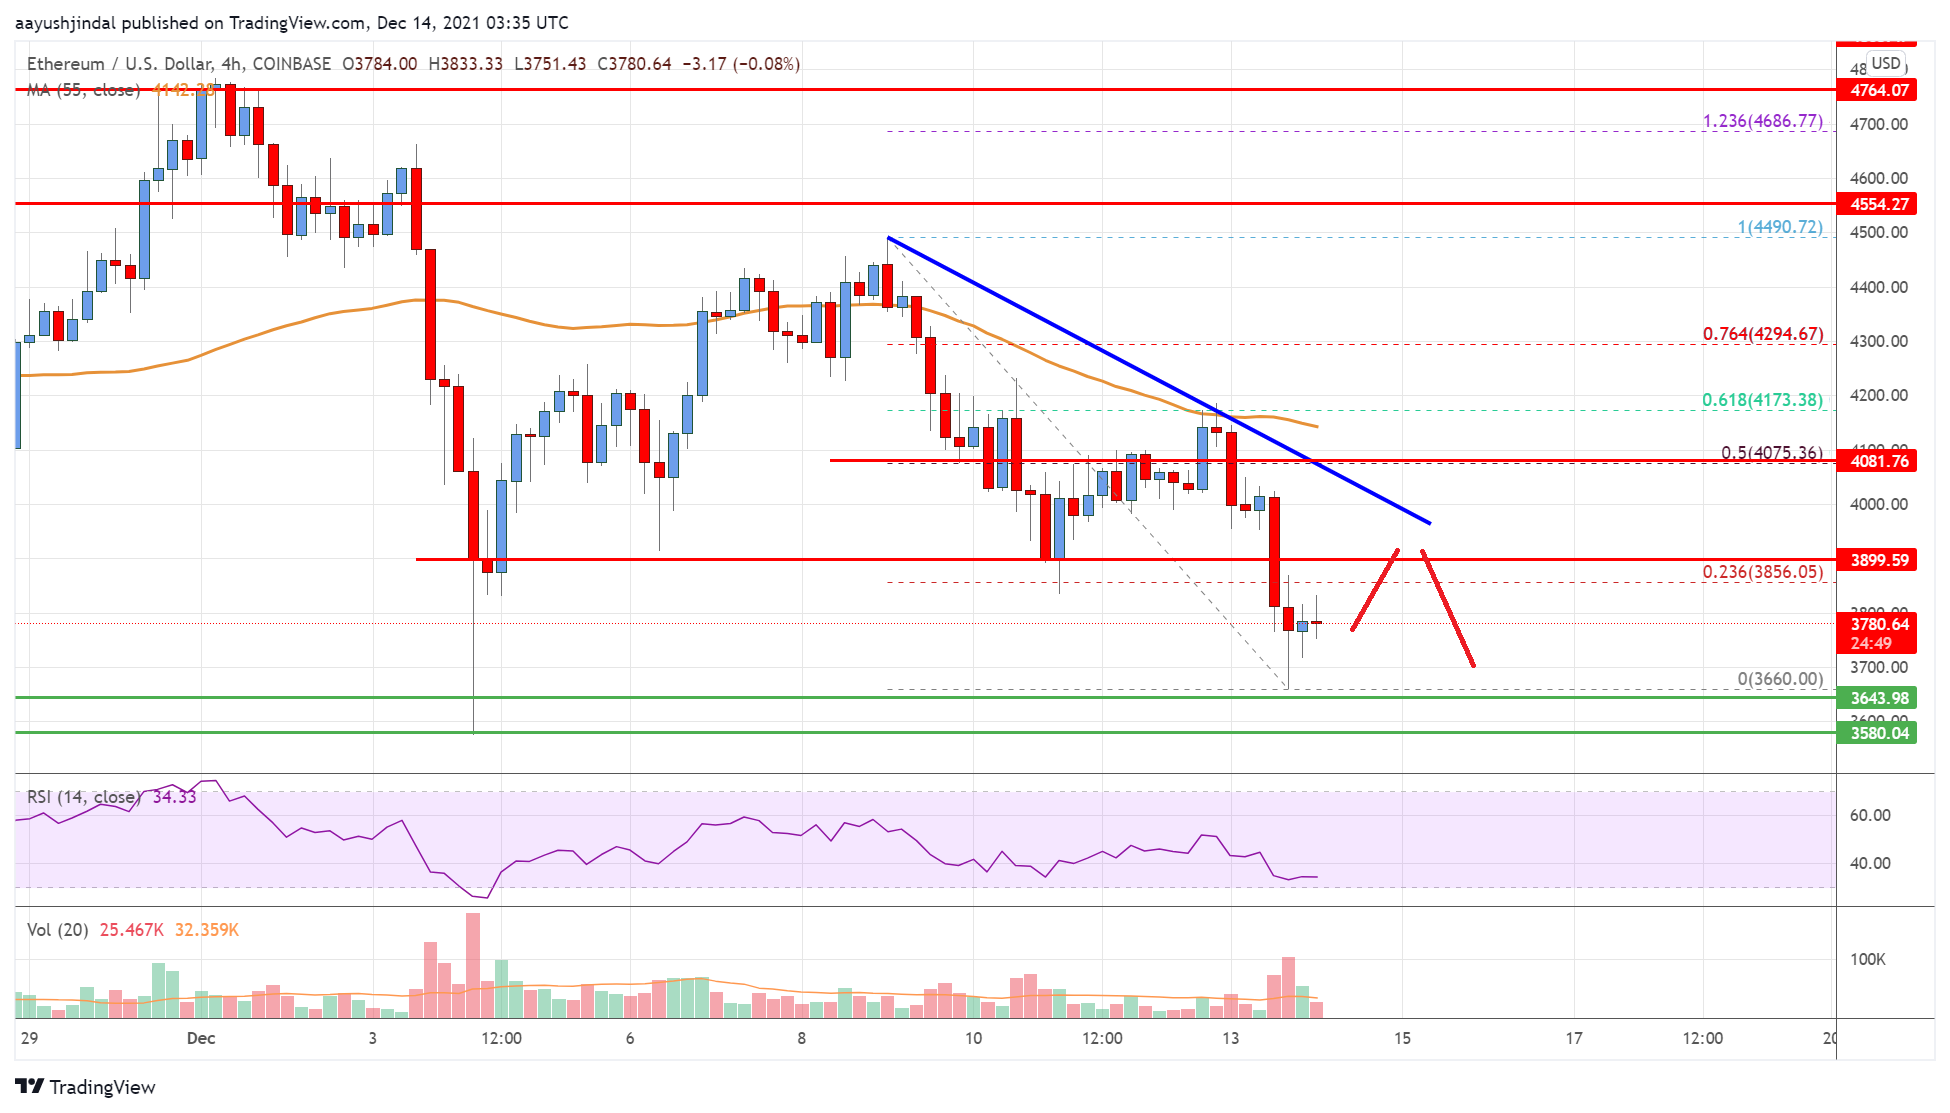
- There is a key bearish trend line forming with resistance near $4,000 on the 4-hours chart (data feed from Coinbase).
- The pair could extend losses if there is a break below the $3,650 support zone.
Ethereum price is showing bearish signs below $4,000 against the US Dollar. ETH/USD could continue to move down if there is no recovery above $4,000.
Ethereum Price Analysis
Recently, ethereum saw a major decline from well above $4,250 against the US Dollar. ETH price traded below the $4,000 support and moved into a bearish zone.
There was also a move below the $3,750 level and the 55 simple moving average (4-hours). A low was formed near $3,660 and the price is now consolidating losses. The price recovered above the $3,750 resistance level. The price is now facing resistance near the $3,850 level.
It is near the 23.6% Fib retracement level of the recent decline from the $4,490 swing high to $3,660 low. The next major resistance is near the $4,000 level.
There is also a key bearish trend line forming with resistance near $4,000 on the 4-hours chart. Any more gains could send the price towards the $4,200 level or the 55 simple moving average (4-hours). An immediate support on the downside is near the $3,660 level. The first major support is now near the $3,600 level.
The next major support is near the $3,500 level, below which the price could test $3,200. Any more losses could lead the price towards $3,000.
Looking at the chart, Ethereum price is clearly trading below the $4,000 zone and near the 55 simple moving average (4-hours). Overall, ether price could extend losses if there is a break below the $3,650 support zone.
Technical indicators
4 hours MACD – The MACD for ETH/USD is slowly gaining momentum in the bearish zone.
4 hours RSI (Relative Strength Index) – The RSI for ETH/USD is now below the 50 level.
Key Support Levels – $3,660, followed by the $3,500 zone.
Key Resistance$ Levels – $4,000 and $4,200.
