- Ethereum price started a major decline after it failed to clear the $220 resistance against the US Dollar.
- ETH price declined sharply below the $200 and $198 support levels.
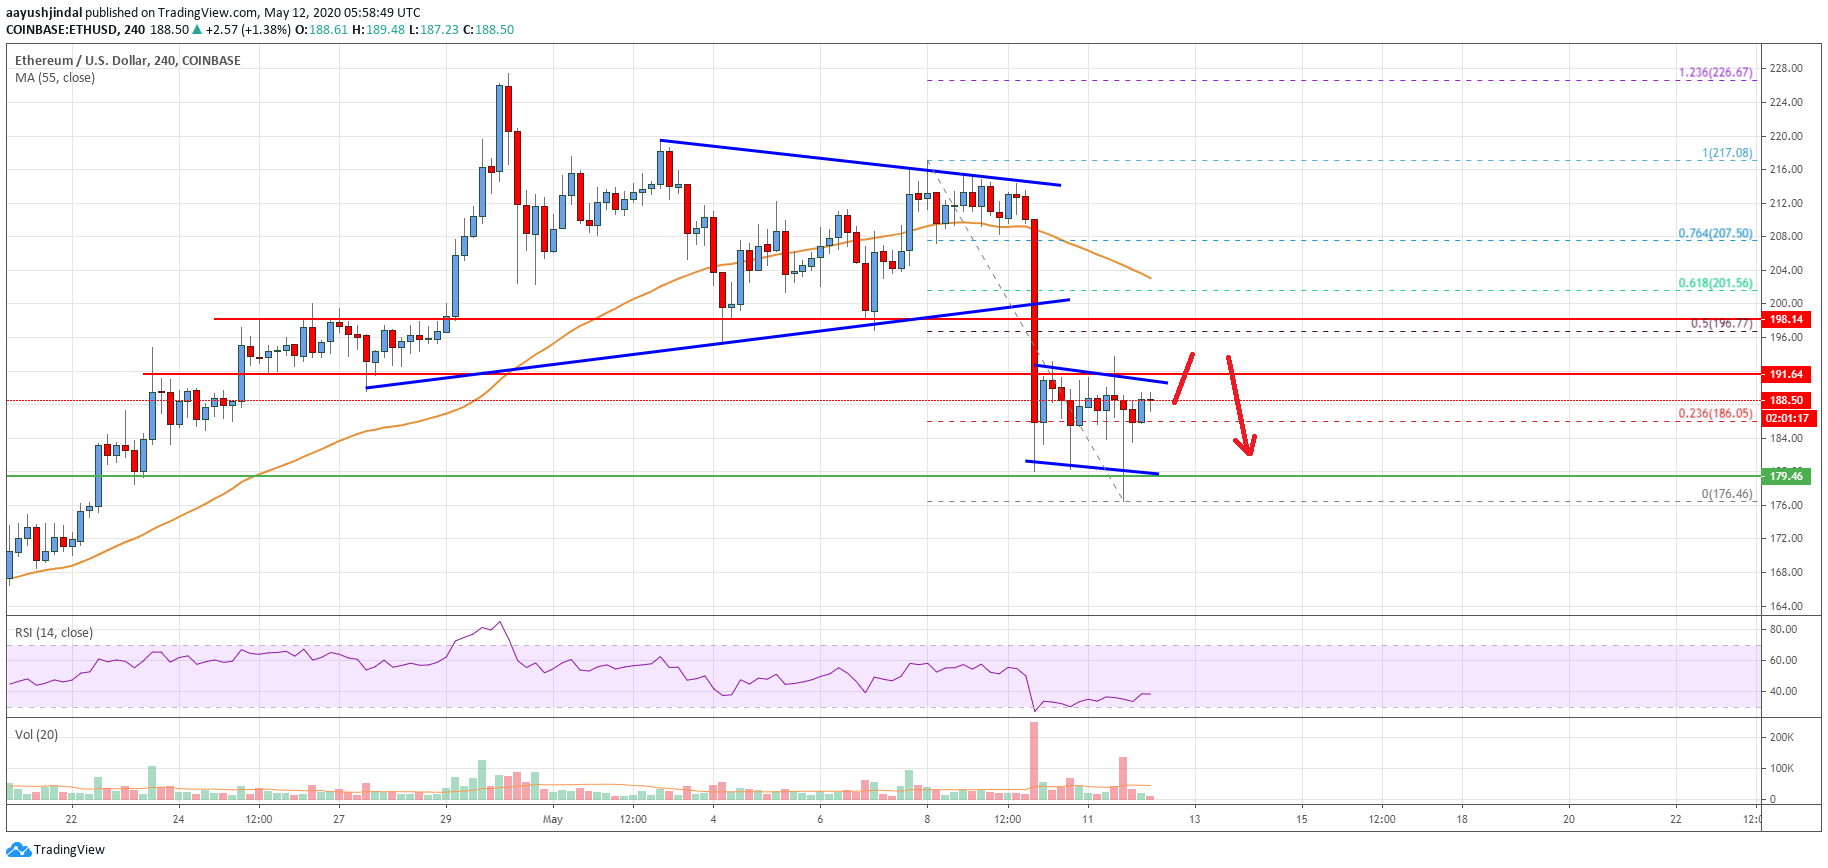
- There was a break below a key contracting triangle with support near $200 on the 4-hours chart (data feed from Coinbase).
- The pair is currently consolidating losses and likely to face resistance near $192 and $198.
Ethereum price is back in a bearish zone below $200 against the US Dollar. ETH/USD is likely to continue lower below $180 as long as it is below $198.
Ethereum Price Analysis
After a couple of failed attempts to clear the $220 resistance, Ethereum price started a major decline against the US Dollar. ETH price broke a few important supports near the $200 level to move into a bearish zone.
During the decline, there was a break below a key contracting triangle with support near $200 on the 4-hours chart. The pair even settled below the $198 pivot level and the 55 simple moving average (4-hours).
The price traded as low as $176 and it is currently consolidating losses. It recovered above the 23.6% Fib retracement level of the recent decline from the $217 swing high to $176 low.
On the upside, an initial resistance is near the $192 level. There is also a short term declining channel forming with resistance near $191. The main resistance on the upside is near the $198 level (the recent breakdown zone).
An intermediate resistance is near the 50% Fib retracement level of the recent decline from the $217 swing high to $176 low. To move into a positive zone, the bulls need to clear the $192 and $198 resistance levels.
The next key resistance is near the $204 level and the 55 simple moving average (4-hours), above which the price could revisit the $220 resistance. Conversely, the price could resume its decline if it fails to clear the $198 resistance.
On the downside, an initial support is near the $180 level, followed by the $176 swing low. A clear break below the $176 low could open the doors for a larger decline towards the $164 level.
Looking at the chart, Ethereum price is trading in a bearish zone below the $192 and $198 levels. Therefore, there are high chances of more losses below the $180 and $175 levels.
Technical indicators
4 hours MACD – The MACD for ETH/USD is currently losing momentum in the bearish zone.
4 hours RSI (Relative Strength Index) – The RSI for ETH/USD is recovering and approaching the 40 level.
Key Support Levels – $180, followed by the $176 zone.
Key Resistance Levels – $192 and $198.
