- Ethereum price started an upside correction after trading as low as $152 against the US Dollar.
- ETH price is currently trading above $175, but it is facing a strong resistance near $185 and $188.
- There is a crucial bearish trend line forming with resistance near $188 on the 4-hours chart (data feed from Coinbase).
- The price is likely to struggle to surpass the key $185 and $188 resistance levels in the near term.
Ethereum price is climbing towards a major resistance near $185-$188 against the US Dollar. ETH price could start a fresh decrease if it fails to clear $188.
Ethereum Price Analysis
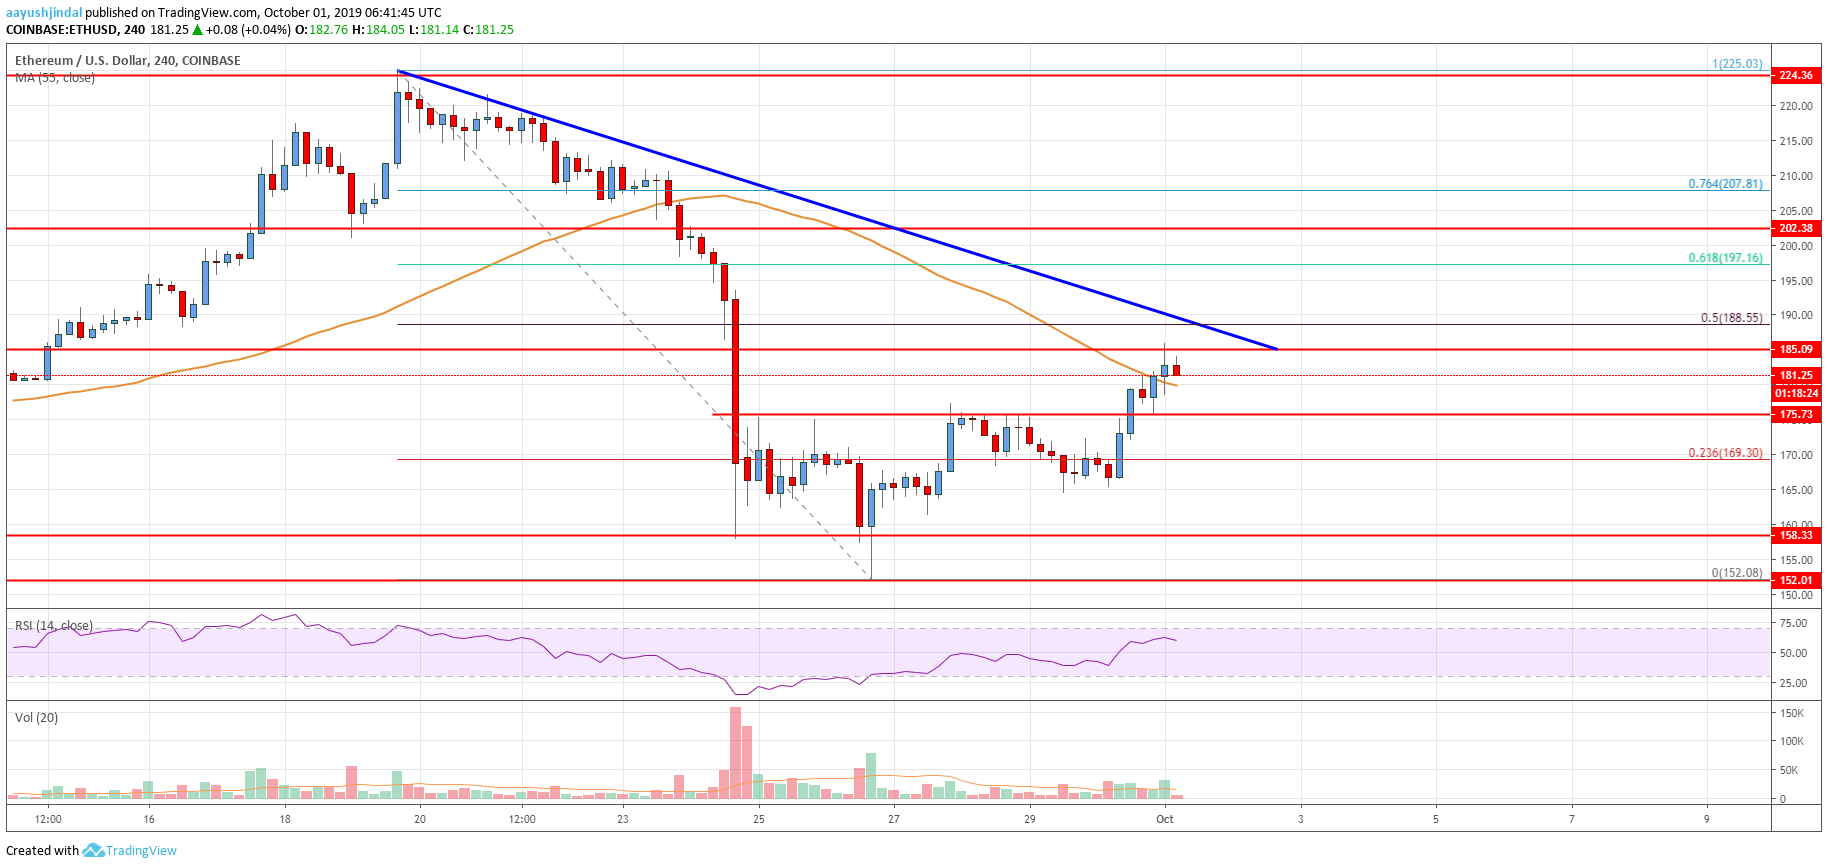
This past week, we saw a nasty decline in Ethereum price below the $200 and $185 supports against the US Dollar. The ETH/USD pair even settled below the $185 support and the 55 simple moving average (4-hours). Moreover, there was a break below the $165 support and the price traded to a new monthly low at $152. Recently, there was an upside correction initiated above the $155 and $165 levels.
The price climbed above the 23.6% Fib retracement level of the last major decline from the $225 high to $152 low. Additionally, the price broke the $175 resistance and the 55 simple moving average (4-hours). At the moment, the price is testing an important resistance area near the $185 level. More importantly, the 50% Fib retracement level of the last major decline from the $225 high to $152 low is at $188.
There is also a crucial bearish trend line forming with resistance near $188 on the 4-hours chart. Therefore, the price is likely to face a strong resistance near the $185 and $188 levels. If there is a successful close above the trend line and $188, the price could recover further towards the $198 and $200 resistance levels. Moreover, the 61.8% Fib retracement level of the last major decline from the $225 high to $152 low is at $197.
Conversely, the price could restart its decline if it fails to climb above $185 or $188. An initial support is near the $175 level. If the price fails to hold the $175 support, it could decline towards the $165 support.
Looking at the chart, Ethereum price is facing a strong resistance near the $185 and $188 levels. There are chances of an upside break, but it won’t be easy for the bulls to gain strength above $185.
Technical indicators
4 hours MACD – The MACD for ETH/USD is gaining momentum in the bullish zone.
4 hours RSI (Relative Strength Index) – The RSI for ETH/USD is currently correcting towards the 50 level.
Key Support Levels – $175, followed by the $165 zone.
Key Resistance Levels – $188 and $200.