- Ethereum price started a fresh increase above the $1,850 resistance against the US Dollar.
- ETH price is currently trading well above $2,000 and the 55 simple moving average (4-hours).
- There is a major bullish trend line forming with support near $2,080 on the 4-hours chart (data feed from Coinbase).
- The pair could dip in the short-term, but the bulls are likely to aim more gains above $2,150 and $2,200.
Ethereum price is now showing a lot of positive signs above $2,000 against the US Dollar. ETH/USD already traded to a new all-time high and it could rally further above $2,200
Ethereum Price Analysis
After forming a support base above $1,700, Ethereum started a fresh increase against the US Dollar. ETH broke many hurdles near $1,850 and $1,920 to move into a positive zone.
The bulls took control and pushed the price above the $2,000 resistance. It even traded above the $2,100 level and formed a new all-time high near $2,155. The price is now trading well above $2,000 and the 55 simple moving average (4-hours).
It is testing the 23.6% Fib retracement level of the upward move from the $2,003 swing low to $2,155 high. The first major support on the downside is near the $2,080 level.
The 50% Fib retracement level of the upward move from the $2,003 swing low to $2,155 high is also near the $2,080 level. The main support is now forming near the $2,050 level. There is also a major bullish trend line forming with support near $2,080 on the 4-hours chart.
Any more losses might lead the price towards the key $2,000 breakdown support zone. Conversely, the price might continue to rise above the $2,140 and $2,150 levels. The next major resistance is near the $2,200 level, above which the price is likely to accelerate higher towards the $2,350 level in the near term.
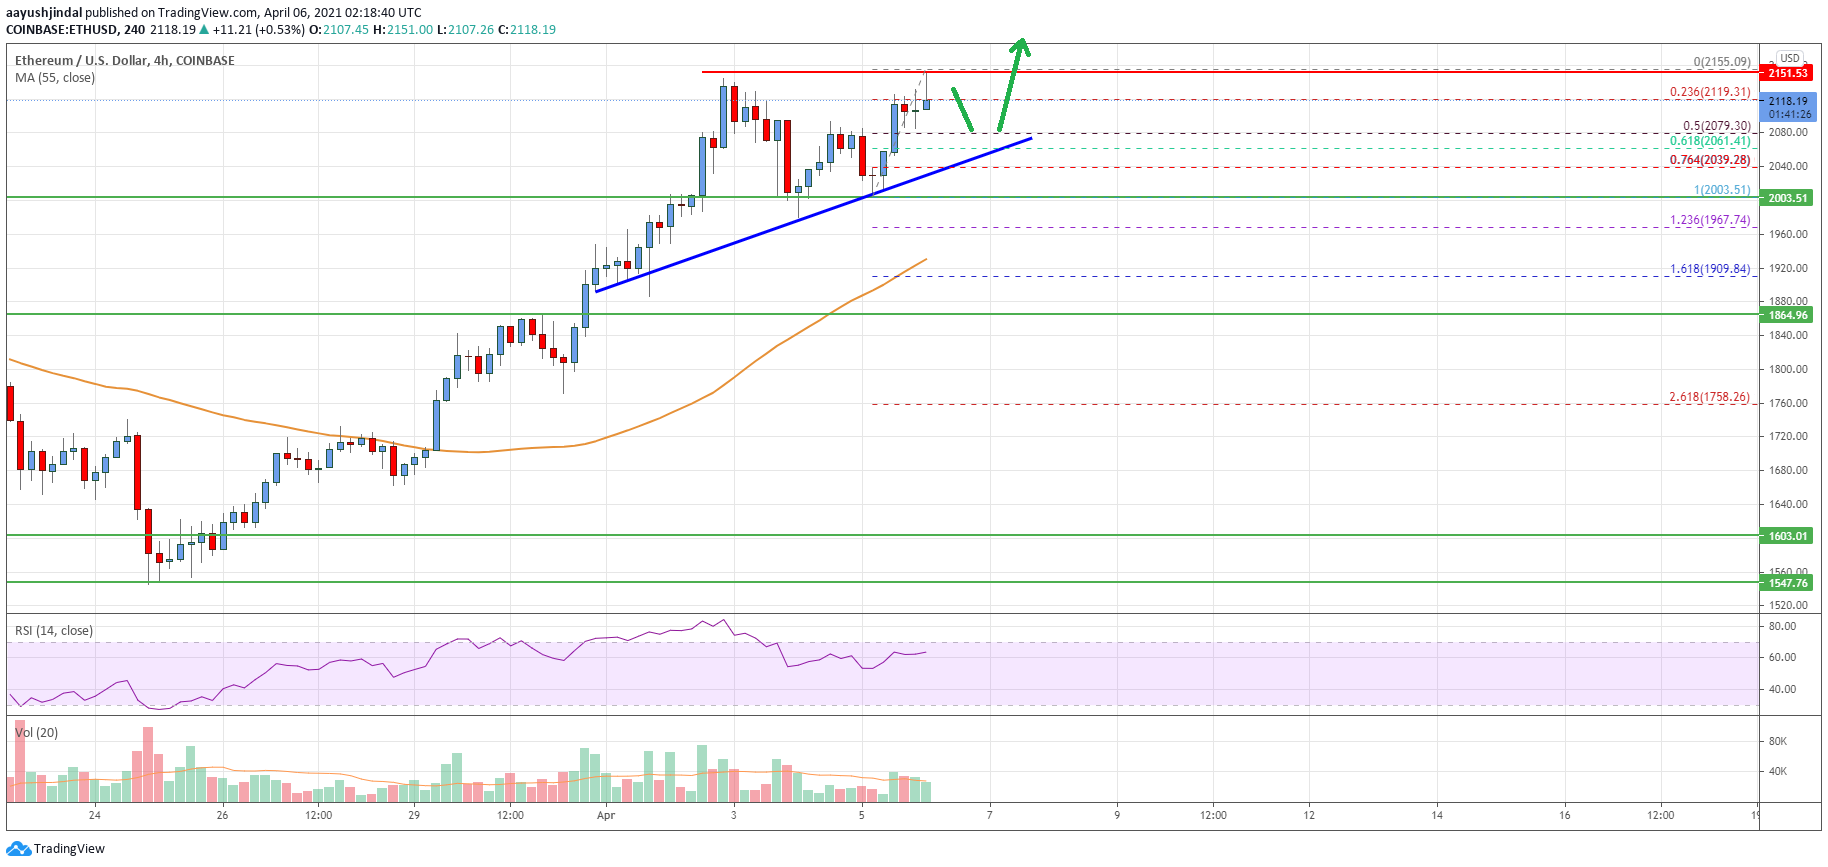
Looking at the chart, Ethereum price is clearly trading well above the $2,000 level and the 55 simple moving average (4-hours). Overall, ether price could dip in the short-term, but the bulls are likely to aim more gains above $2,150 and $2,200.
Technical indicators
4 hours MACD – The MACD for ETH/USD is gaining momentum in the bullish zone.
4 hours RSI (Relative Strength Index) – The RSI for ETH/USD is now well above the 50 level.
Key Support Levels – $2,050, followed by the $2,000 zone.
Key Resistance Levels – $2,150 and $2,200.