
- Ethereum price started a fresh decline and it broke the $2,000 support zone against the US Dollar.
- ETH price is now trading well below $2,000 and the 55 simple moving average (4-hours).
- There is a major bearish trend line forming with resistance near $1,850 on the 4-hours chart (data feed from Coinbase).
- The pair is likely to accelerate lower if there is a close below the $1,750 support zone.
Ethereum price is showing bearish signs below $2,000 against the US Dollar. ETH/USD could decline heavily towards the $1,500 level in the near term.
Ethereum Price Analysis
In the past few days, ethereum started a steady decline from well above $2,200 against the US Dollar. ETH price broke the main $2,000 support zone to enter a bearish zone.
The price even broke the $1,850 support level and it settled well below the 55 simple moving average (4-hours). It even traded below the $1,800 level and a low is formed near $1,759. The price is clearly showing a lot of bearish signs below $1,800.
An initial support is near the $1,750 level. If there is a downside break below the $1,750 support, there is a risk of more downsides. The next key support is near the $1,680 level. Any more losses might call for a test of the $1,500 level in the near term.
On the upside, an immediate resistance is near the $1,815 level. It is near the 23.6% Fib retracement level of the recent decline from the $1,996 swing high to $1,759 low.
The first major resistance is near the $1,850 zone. There is also a major bearish trend line forming with resistance near $1,850 on the 4-hours chart. The trend line is also close to the 50% Fib retracement level of the recent decline from the $1,996 swing high to $1,759 low.
A clear break above the trend line and $1,900 may possibly push the price towards the main $2,000 resistance zone. To move into a positive zone, the price must settle above $2,000 and the 55 simple moving average (4-hours).
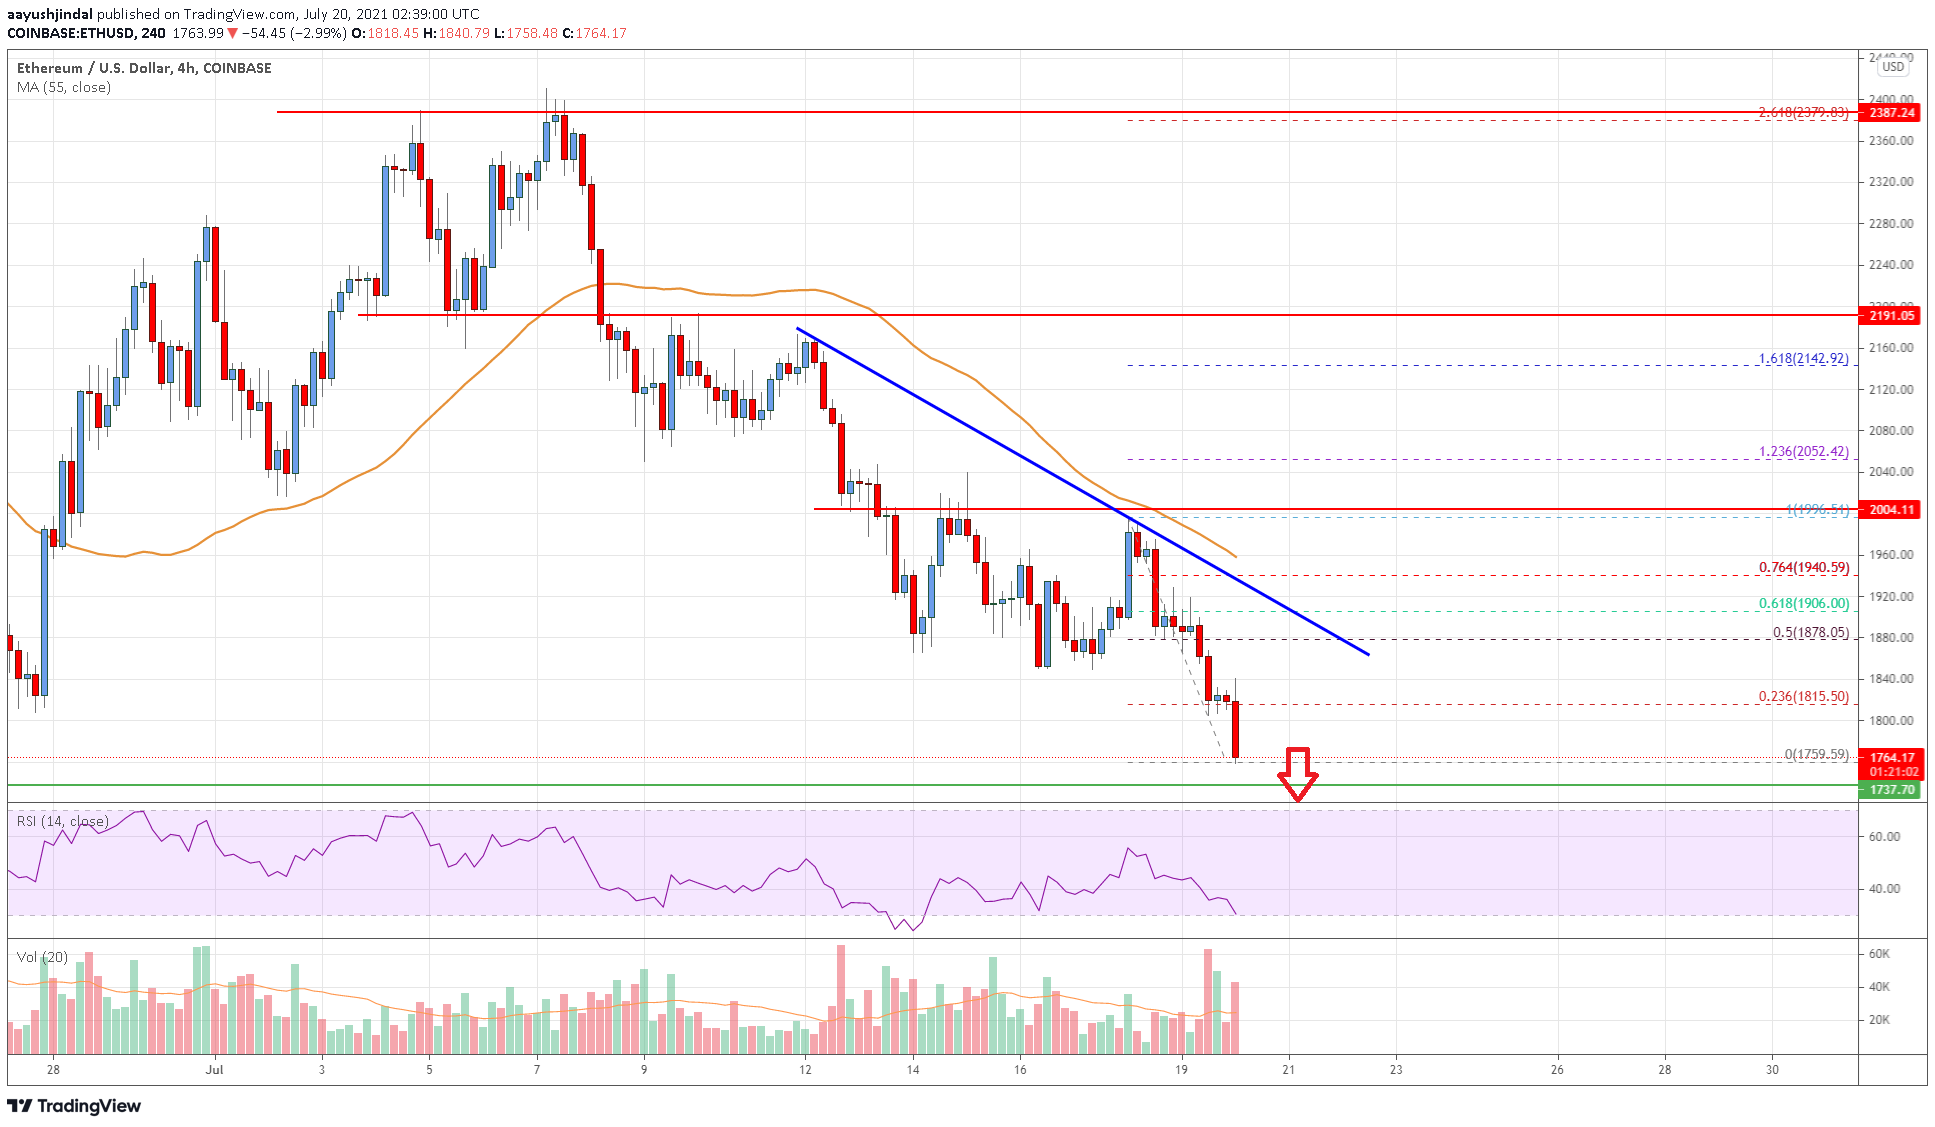
Looking at the chart, Ethereum price is clearly trading well below the $2,000 zone and the 55 simple moving average (4-hours). Overall, ether price is likely to accelerate lower if there is a break below the $1,750 support zone.
Technical indicators
4 hours MACD – The MACD for ETH/USD is gaining momentum in the bearish zone.
4 hours RSI (Relative Strength Index) – The RSI for ETH/USD is well below the 50 level.
Key Support Levels – $1,750, followed by the $1,650 zone.
Key Resistance Levels – $1,850 and $2,000.


Leave a Reply
You must be logged in to post a comment.