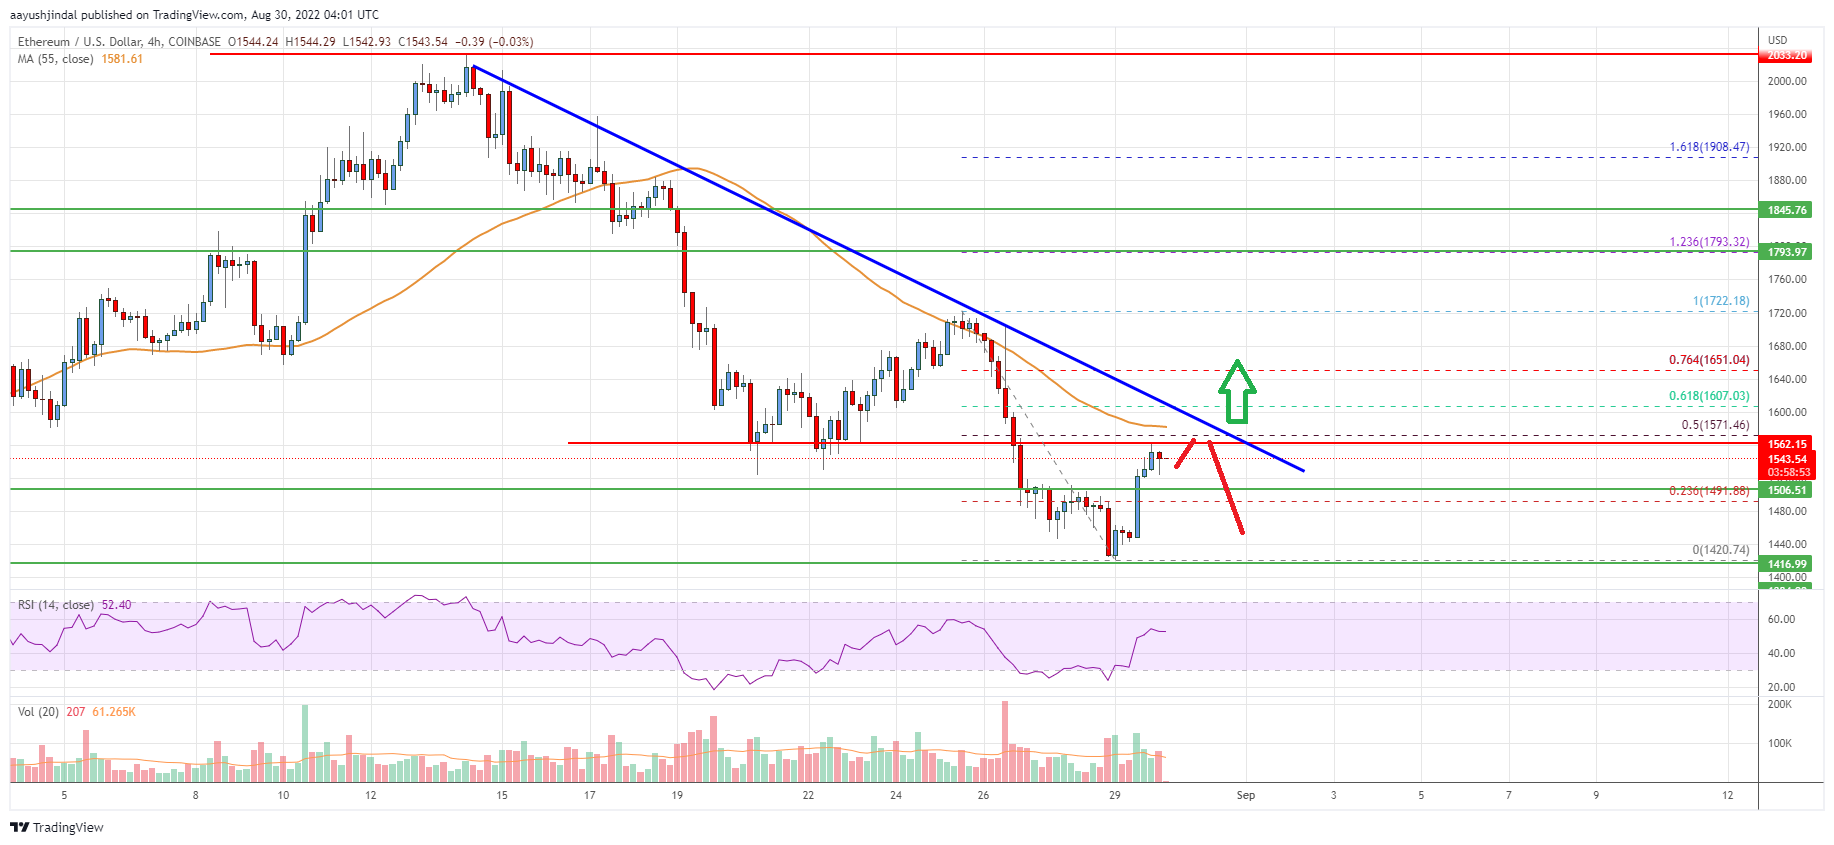
- Ethereum price started a fresh decline from the $1,700 zone against the US Dollar.
- ETH price is now trading below $1,600 and the 55 simple moving average (4-hours).
- There is a key bearish trend line forming with resistance near $1,570 on the 4-hours chart (data feed from Coinbase).
- The pair could start a fresh increase unless there is a clear move below the $1,420 zone.
Ethereum price is struggling below $1,600 against the US Dollar. ETH/USD remains at a risk of more losses if there is a break below the $1,420 zone.
Ethereum Price Analysis
This past week, ethereum faced a rejection near the $1,700 zone against the US Dollar. ETH price failed to gain strength and started a fresh decline below the $1,600 level.
There was a clear move below the $1,550 and $1,500 support levels. The pair accelerated lower below the $1,500 level and the 55 simple moving average (4-hours). It traded as low as $1,420 and recently started an upside correction.
There was a clear move above the $1,500 resistance zone. The price climbed above the 23.6% Fib retracement level of the downward move from the $1,722 swing high to $1,420 low.
The price is now consolidating losses above the $1,500 level. An immediate resistance is near the $1,570 level and the 55 simple moving average (4-hours). It is near the 50% Fib retracement level of the downward move from the $1,722 swing high to $1,420 low.
The next major resistance is near the $1,600 zone, above which the price could test $1,650. Any more gains could even send the price above the $1,720 resistance zone.
On the downside, an initial support is near the $1,505 level. The next major support is now near the $1,420 level. A break below the $1,420 support could push the price to $1,350. Any more losses could lead the price towards $1,250 or even $1,200 in the coming days.

Looking at the chart, Ethereum price is clearly trading below the $1,600 zone and the 55 simple moving average (4-hours). Overall, ether price could start a fresh increase unless there is a clear move below the $1,420 zone.
Technical indicators
4 hours MACD – The MACD for ETH/USD is now losing momentum in the bearish zone.
4 hours RSI (Relative Strength Index) – The RSI for ETH/USD is now above the 50 level.
Key Support Levels – $1,505, followed by the $1,420 zone.
Key Resistance$ Levels – $1,570 and $1,600.


Leave a Reply
You must be logged in to post a comment.