- Ethereum price failed to clear the $400 barrier and declined recently against the US Dollar.
- ETH price is trading below the $352 support level and the 55 simple moving average (4-hours).
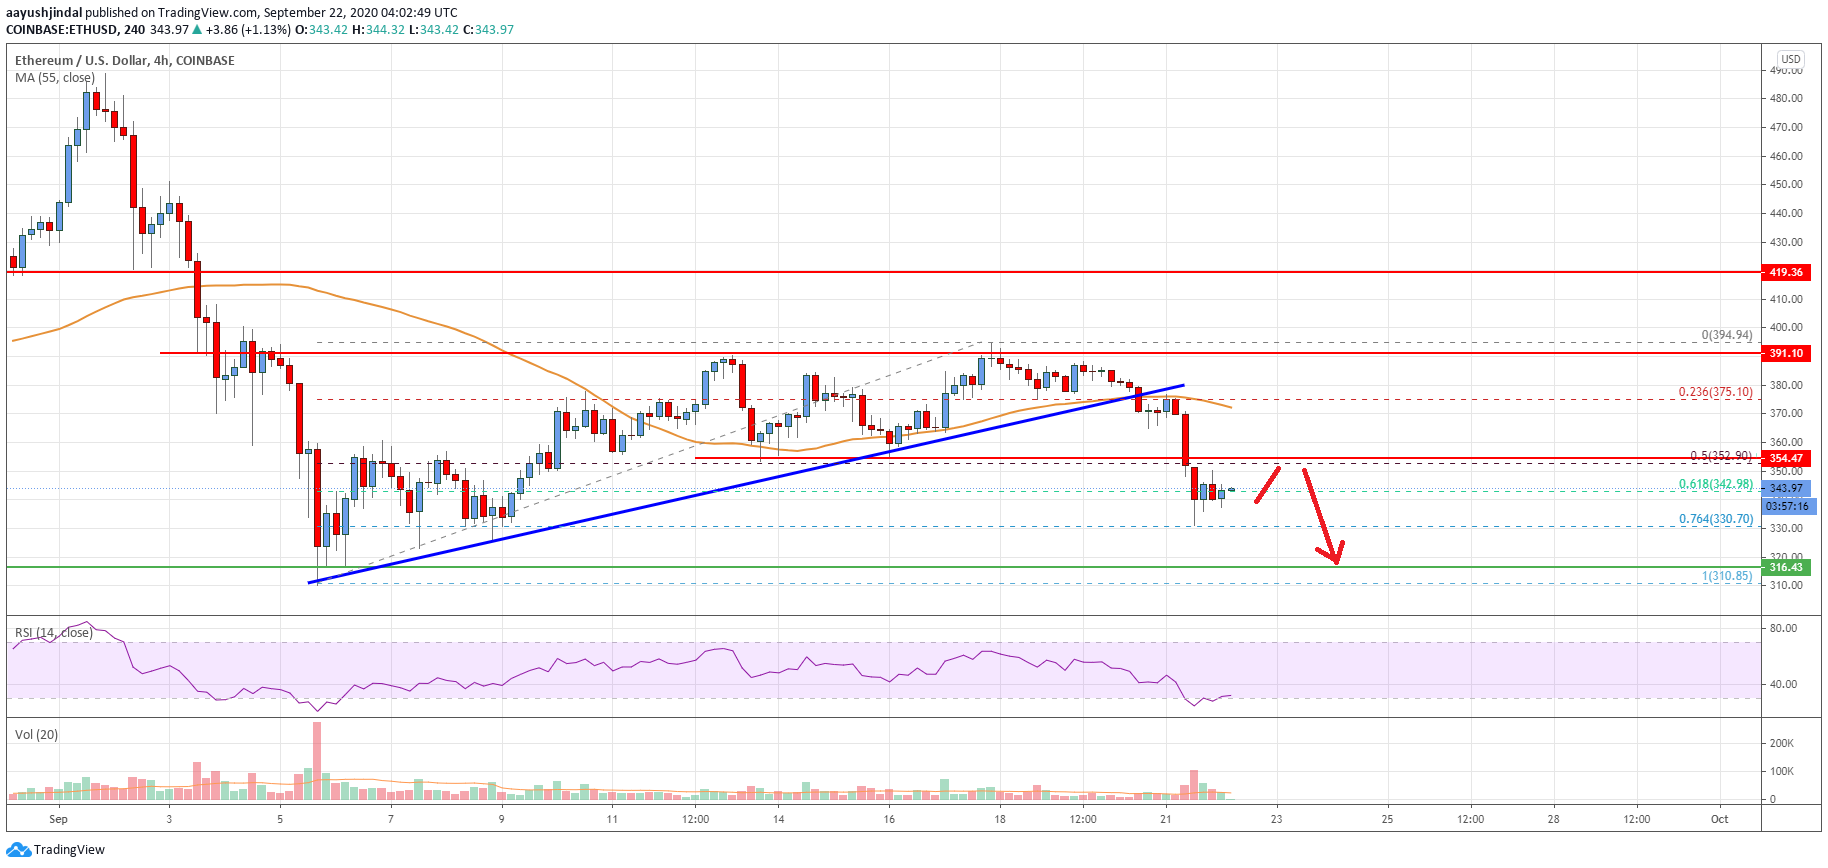
- There was a break below a key bullish trend line with support near $375 on the 4-hours chart (data feed from Coinbase).
- The pair could accelerate further if it breaks the $330 support level in the near term.
Ethereum price is declining and trading below the $352 support against the US Dollar. It seems like ETH/USD is likely to continue lower below $330 and $320.
Ethereum Price Analysis
After a failed attempt to clear the $400 resistance zone, Ethereum price started a fresh decline against the US Dollar. ETH price broke a couple of key support near the $375 level to move into a bearish zone.
The price traded below the 50% Fib retracement level of the upward move from the $310 swing low to $394 high. Moreover, there was a break below a key bullish trend line with support near $375 on the 4-hours chart.
The decline was such that the price broke the key $352 support and settled well below the 55 simple moving average (4-hours). It tested the $330 support zone and the 76.4% Fib retracement level of the upward move from the $310 swing low to $394 high.
It seems like the price is currently consolidating losses above the $330 support. On the upside, the previous key support near the $352 level is likely to act as a major resistance.
The next major resistance is near the $370 level or the 55 simple moving average (4-hours). On the downside, the price is likely to find bids near the $330 level. If there is a downside break below the $330 support, the price could accelerate lower towards the $316 support.
The next major support for the bulls is near the $310 swing low, below which the bears are likely to aim a larger decline below the $300 support zone in the coming sessions.

Looking at the chart, Ethereum price is clearly trading below the $352 support level and the 55 simple moving average (4-hours). Overall, the price could accelerate further if it breaks the $330 support level in the near term.
Technical indicators
4 hours MACD – The MACD for ETH/USD is now gaining momentum in the bearish zone.
4 hours RSI (Relative Strength Index) – The RSI for ETH/USD is now below the 40 level.
Key Support Levels – $330, followed by the $310 zone.
Key Resistance Levels – $352 and $370.


Leave a Reply
You must be logged in to post a comment.