- Ethereum price struggled to clear the $280 resistance and declined recently against the US Dollar.
- ETH price is declining and it is now trading below the $270 support area.
- There was a break below a major contracting triangle with support near $265 on the 4-hours chart (data feed from Coinbase).
- The price is likely to continue lower towards the $243 support level in the near term.
Ethereum price is showing a few bearish signs below the $270 support against the US Dollar. ETH/USD could slide in the coming sessions towards $243 or $230.
Ethereum Price Analysis
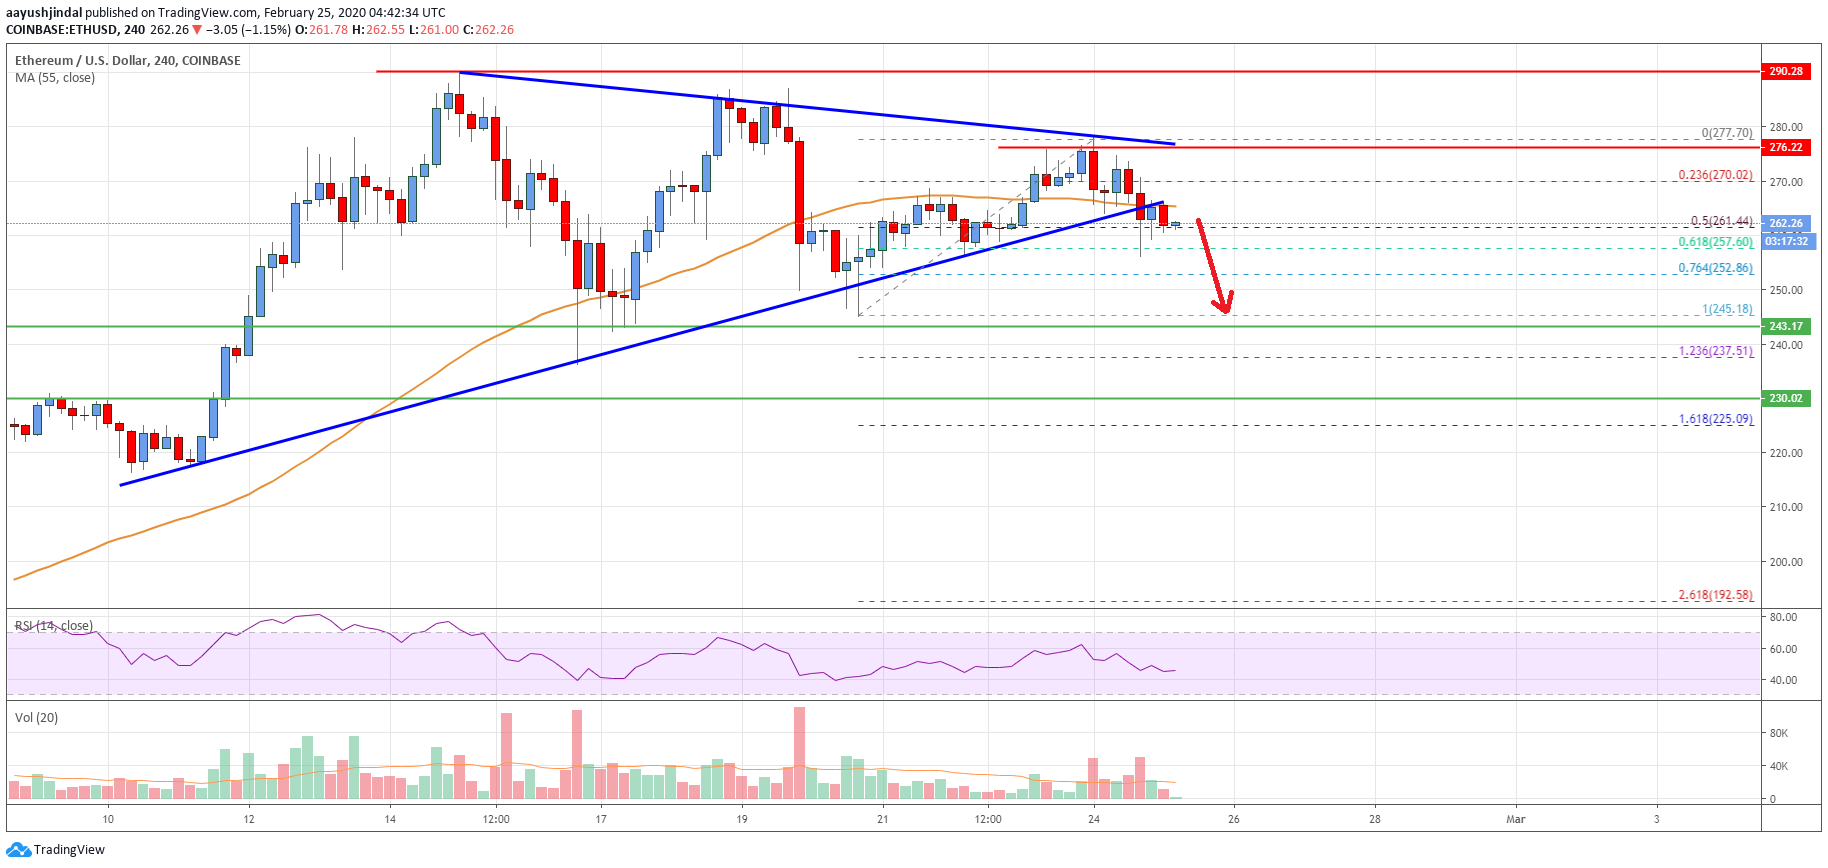
Recently, Ethereum price made another attempt to gain pace above the $278 and $280 levels against the US Dollar. However, ETH price failed to continue higher, formed a top near $277 and declined recently.
There was a break below the key $270 support level and the 55 simple moving average (4-hours). Moreover, the price declined below the 50% Fib retracement level of the upward move from the $245 swing low to $277 swing high.
More importantly, there was a break below a major contracting triangle with support near $265 on the 4-hours chart. It opened the doors for more losses below the $260 support area.
On the downside, an initial support is near the $257 level. It represents the 61.8% Fib retracement level of the upward move from the $245 swing low to $277 swing high. If Ethereum price fails to stay above the $257 level, there is a risk of a larger decline.
The next major support is seen near the $243 level. Any further losses could lead the price towards the $230 support level. An intermediate support is near the 1.236 Fib extension level of the upward move from the $245 swing low to $277 swing high.
Conversely, the price might attempt once more to climb above $270 and $280. An initial resistance is near the $268 level and the 55 simple moving average (4-hours).
The main resistance is still near the $276 level, above which there are high chances of a strong rise towards the $288 and $292 levels in the near term.

Looking at the chart, Ethereum price is clearly showing a few bearish signs below the $270 and $268 levels. Therefore, the bears are likely to aim a test of the $243 support level.
Technical indicators
4 hours MACD – The MACD for ETH/USD is currently gaining momentum in the bearish zone.
4 hours RSI (Relative Strength Index) – The RSI for ETH/USD is now sliding and it is below the 50 level.
Key Support Levels – $257, followed by the $243 zone.
Key Resistance Levels – $270 and $288.


Leave a Reply
You must be logged in to post a comment.