- Ethereum price remains well bid above the $270 level and recently recovered against the US Dollar.
- ETH price broke the key $292 and $300 resistance levels to move into a positive zone.
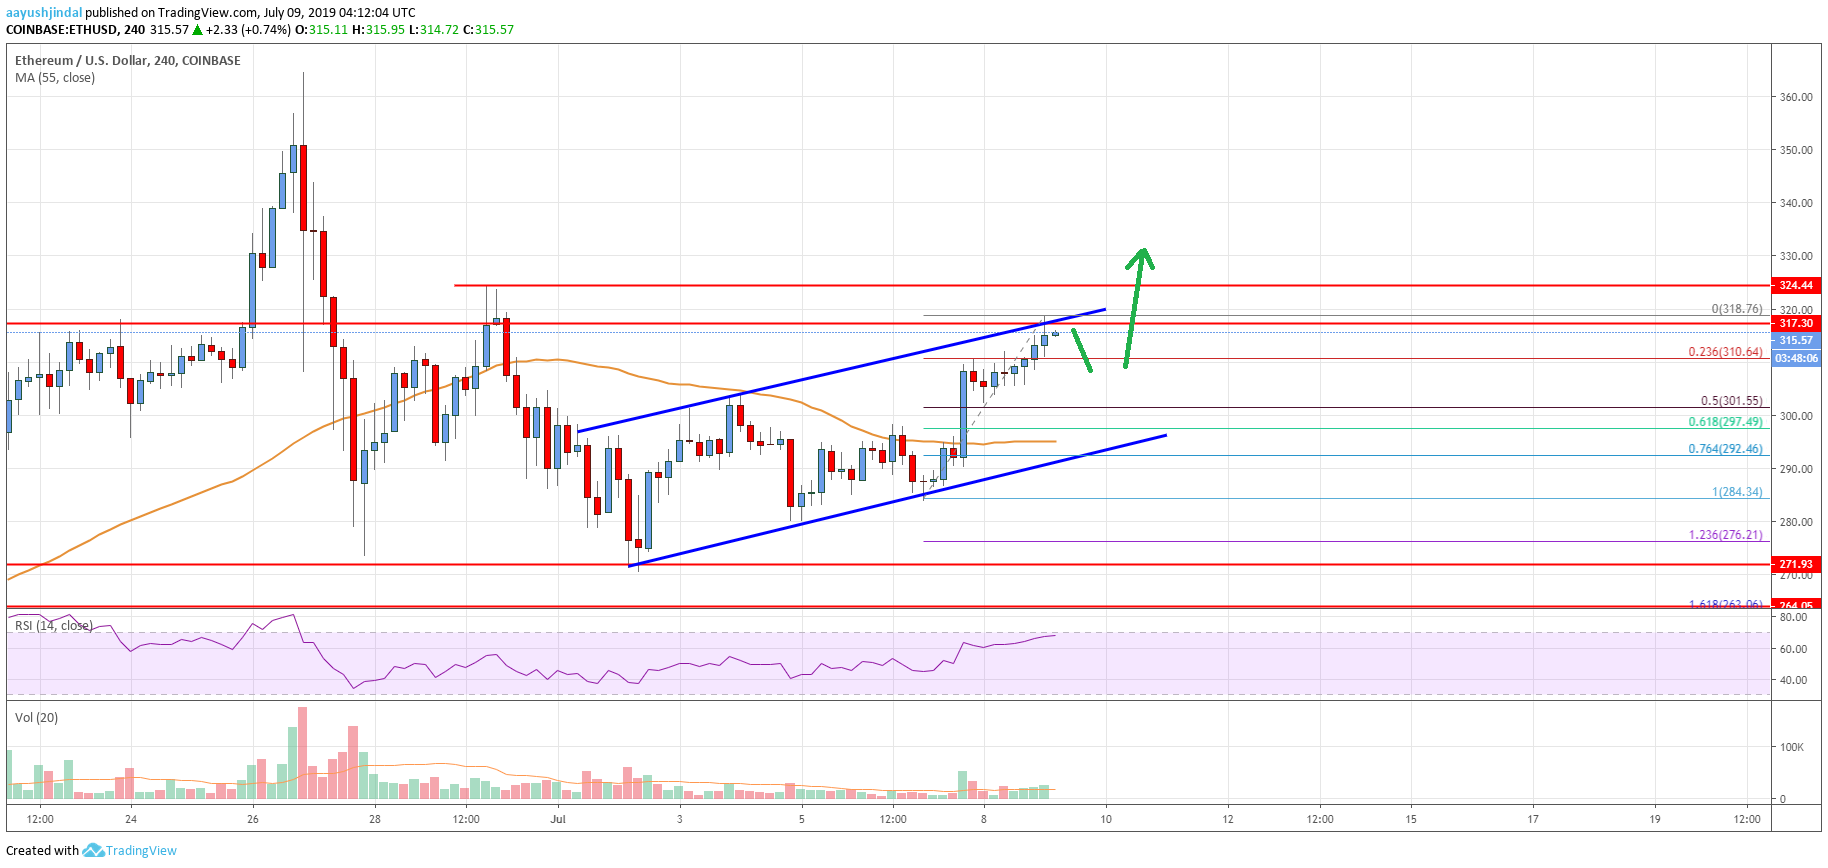
- There is a key ascending channel forming with current resistance near $318 on the 4-hours chart (data feed from Coinbase).
- The price could surge towards $340 if there is a successful close above the $320 resistance.
Ethereum price is showing positive signs above the $300 level against the US Dollar. ETH might start a strong rise if it clears the $320 and $325 resistance levels in the near term.
Ethereum Price Analysis
After trading towards the $270 level, Ethereum price found a strong buying interest against the US Dollar. The ETH/USD pair traded as low as $271 and recently started a fresh increase. There was a break above the $285 and $290 resistance levels. Moreover, the price successfully settled above the $300 level and the 55 simple moving average (4-hours). It cleared the path for more gains and the price spiked above the $315 level.
It traded to a new monthly high near the $318 level and it is currently consolidating gains. On the upside, there are a few important resistances near $318, $320 and $325. Moreover, there is a key ascending channel forming with current resistance near $318 on the 4-hours chart. On the downside, an initial support is near the $310 level plus the 23.6% Fib retracement level of the recent wave from the $284 low to $318 high.
If there is a downside correction below the $310 support, the price could test the $300-301 support area. The 50% Fib retracement level of the recent wave from the $284 low to $318 high is also near the $301 level to provide support. The next major support is near the channel support at $294 and the 55 simple moving average (4-hours). If there is a downside break below $292 and the 55 simple moving average (4-hours), the price could decline towards $270.
On the upside, the price must break the $318, $320 and $325 resistance levels. Once there is a successful close above the $320 and $325 levels, the price is likely to accelerate towards the $340 and $350 levels.

Looking at the chart, Ethereum price is currently struggling near a few important hurdles such as $318, $320 and $325. Once the price clears these, there could be more gains towards $350.
Technical indicators
4 hours MACD – The MACD for ETH/USD is currently gaining momentum in the bullish zone.
4 hours RSI (Relative Strength Index) – The RSI for ETH/USD is currently above the 60 level, with a positive bias.
Key Support Levels – $310, followed by the $300 zone.
Key Resistance Levels – $320 and $325.


Leave a Reply
You must be logged in to post a comment.