- Tron price rallied recently above the $0.0325 and $0.0342 resistance levels against the US Dollar.
- TRX price traded as high as $0.0358 before it corrected lower sharply below $0.0340.
- There was a break above a major bearish trend line with resistance near $0.0322 on the 4-hours chart (data feed via Bitfinex).
- The price remains well supported on the downside and it could rise again towards $0.0355 or $0.0362.
TRON price is showing a few positive signs against the US Dollar, but under pressure vs bitcoin. TRX price could grind higher once again towards the $0.0355 level as long as it is above $0.0325.
Tron Price Analysis
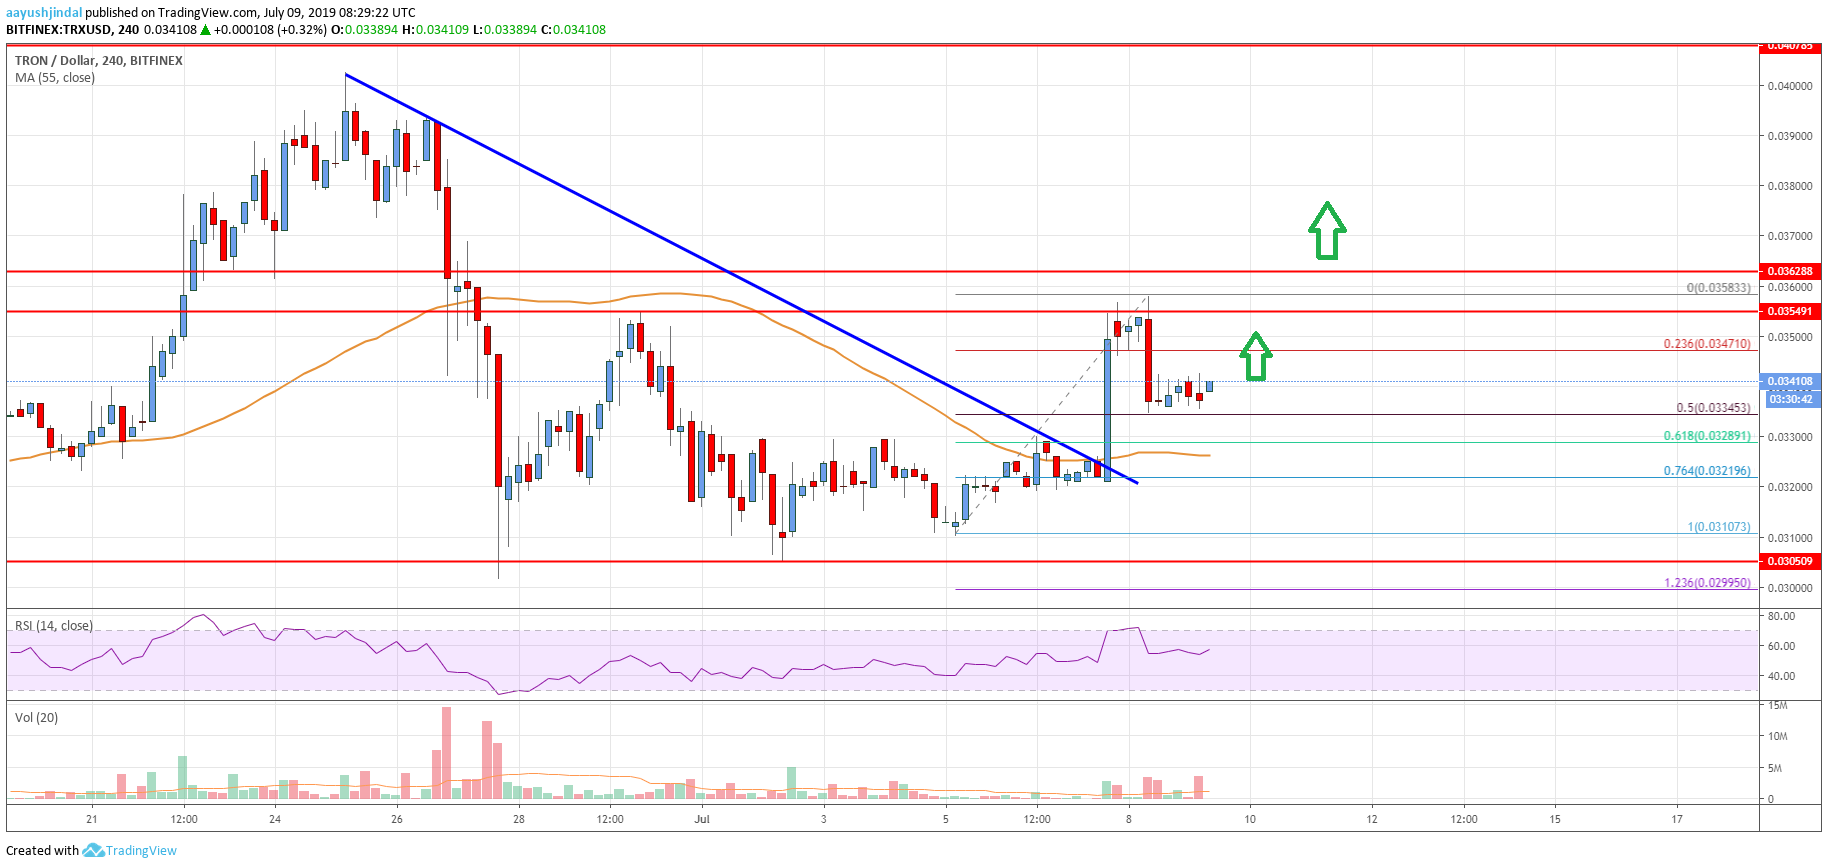
There was a decent support formed by TRON price above $0.0310 against the US Dollar. The TRX/USD pair started a decent rise after forming a swing low at $0.03107. It broke the key $0.0320 and $0.0325 resistance levels to move into a positive zone. Moreover, there was a proper close above the $0.0325 level plus the 55 simple moving average (4-hours).
More importantly, there was a break above a major bearish trend line with resistance near $0.0322 on the 4-hours chart. The pair rallied above the $0.0340 and $0.0350 levels. A new weekly high was formed near $0.0358 before the price started a major downside correction. It traded below the $0.0345 support and the 23.6% Fibonacci retracement level of the last wave from the $0.0310 low $0.0358 high.
However, the $0.0334 level acted as a strong support. It represents the 50% Fibonacci retracement level of the last wave from the $0.0310 low $0.0358 high. Moreover, the price stayed well above the $0.0325 pivot level and the 55 simple moving average (4-hours). It is currently consolidating gains above the $0.0334 level. On the upside, there are a few important resistances near $0.0347 and $0.0350.
If there is an upside beak above $0.0350, there are chances of a strong rise above the $0.0360 and $0.0362 levels. On the downside, the key support is near the $0.0334 level. If there is a downside break below $0.0334, the price could test the main support near the $0.0325 level and the 55 simple moving average (4-hours).

The chart indicates that TRX price is trading with a positive bias and it could rise again towards $0.0350 and $0.0355. However, if it fails to stay above the 55 simple moving average (4-hours) and $0.0325, there could be a fresh drop towards $0.0300.
Technical Indicators
4 hours MACD – The MACD for TRX/USD is gaining pace in the bullish zone.
4 hours RSI – The RSI for TRX/USD is currently above the 50 level, with a bullish angle.
Key Support Levels – $0.0334 and $0.0325.
Key Resistance Levels – $0.0347, $0.0350 and $0.0358.


Leave a Reply
You must be logged in to post a comment.