- Ethereum price traded towards the $470 level before correcting lower against the US Dollar.
- ETH price is currently trading well above $400 and the 55 simple moving average (4-hours).
- There is a major contracting triangle forming with resistance near $452 on the 4-hours chart (data feed from Coinbase).
- The pair could either restart its rally above the $455 level or it might revisit the $400 support zone.
Ethereum price is trading in a positive zone above $420 against the US Dollar. ETH/USD could accelerate higher once again if it clears the $455 and $460 levels.
Ethereum Price Analysis
In the past few days, there was a sharp increase in Ethereum price from well below the $400 level against the US Dollar. ETH price broke the $420 resistance level and settled well above the 55 simple moving average (4-hours).
There was even a break above the $450 level. The price traded close to $470 before starting a downside correction. There was a sharp decline below the $440 level, but the price remained well bid above the $420 support zone.
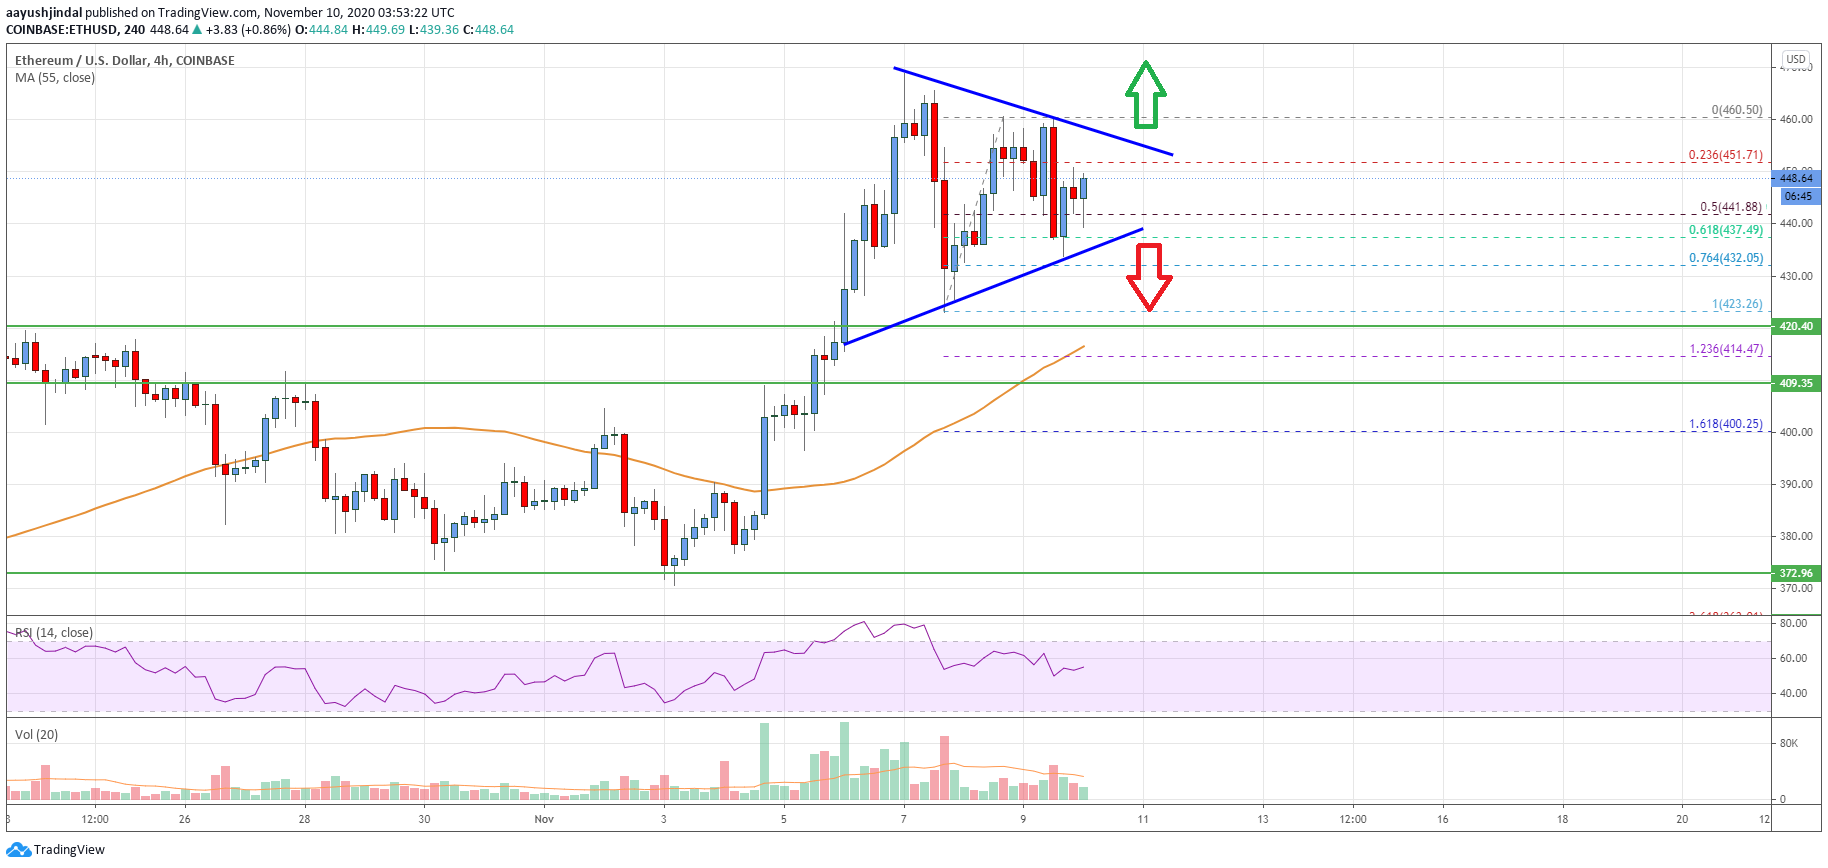
A swing low was formed near $423 before the price recovered higher. It traded as high as $460 and seems to be consolidating in a range. It corrected below the $450 level, and the 50% Fib retracement level of the upward move from the $423 swing low to $460 swing high.
It seems like there is a major contracting triangle forming with resistance near $452 on the 4-hours chart. If there is an upside break above the triangle resistance and $455, the price could start a strong upward move. The next key resistance is near the $460 level, above which the price bulls might aim a test of the $480 level.
An initial support on the downside is near the $440 level. The triangle support is also close to the 61.8% Fib retracement level of the upward move from the $423 swing low to $460 swing high.
If there is a downside break below the triangle support, with a follow through move below the $435 level, the price could continue to move down. The next major support is near the $423 low. Any further losses could open the doors for a larger decline towards the $405 and $400 support levels in the near term.
Looking at the chart, Ethereum price is clearly consolidating above the $440 support. Overall, ether could either restart its rally above the $455 level or it might revisit the $400 support zone.
Technical indicators
4 hours MACD – The MACD for ETH/USD is gaining momentum in the bullish zone.
4 hours RSI (Relative Strength Index) – The RSI for ETH/USD is still above the 50 level.
Key Support Levels – $440, followed by the $423 zone.
Key Resistance Levels – $455 and $470.