- Ethereum price declined heavily below $244 and recently found support near $210 against the US Dollar.
- ETH price is currently recovering and it is trading above the $225 resistance area.
- There was a break above a key bearish trend line with resistance near $225 on the 4-hours chart (data feed from Coinbase).
- The price is likely to continue higher towards the $244 and $250 resistance levels in the near term.
Ethereum price is showing signs of a decent recovery above $225 against the US Dollar. ETH/USD could accelerate if it gains pace above the $235 zone.
Ethereum Price Analysis
This past week, we saw a downside extension in Ethereum price below the key $244 support against the US Dollar. ETH price even settled below the $240 level and the 55 simple moving average (4-hours).
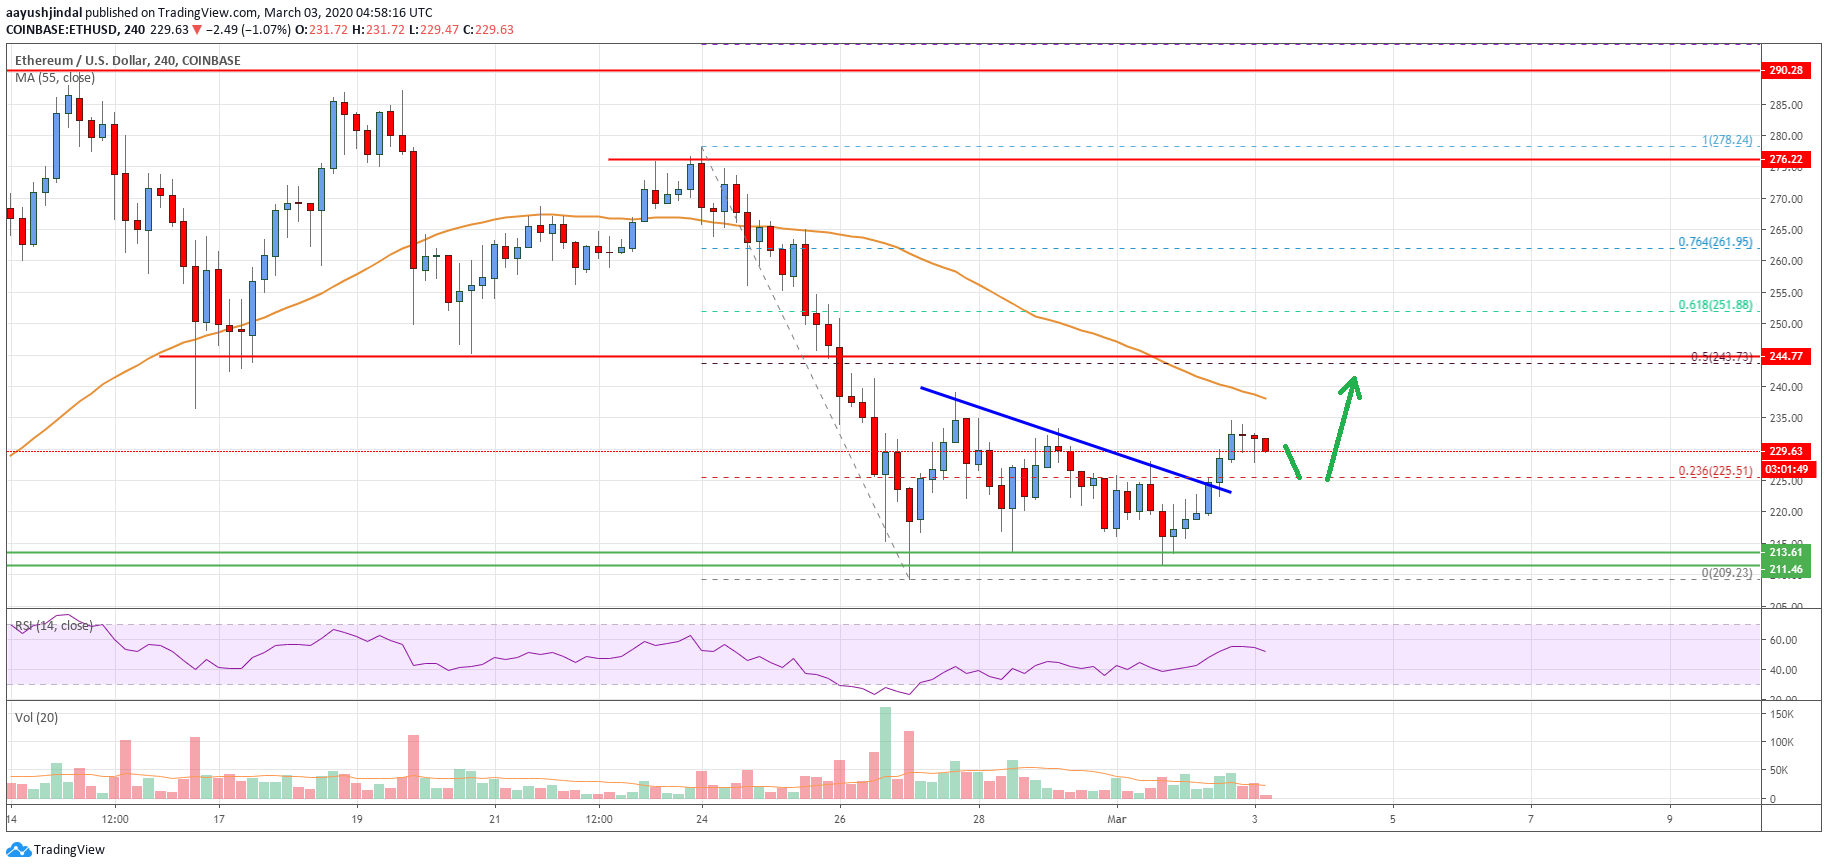
The price spiked below the $220 support and traded as low as $209. Recently, it formed a decent support base near $210 and started an upside correction. It surpassed the 23.6% Fib retracement level of the downward move from the $278 high to $209 low.
Moreover, there was a break above a key bearish trend line with resistance near $225 on the 4-hours chart. The pair is now trading above the $225 and $228 resistance levels.
An initial resistance on the upside is near the $235 level and the 55 simple moving average (4-hours). Above the 55 SMA, the main resistance is waiting near the $244 area (the last key breakdown zone).
The 50% Fib retracement level of the downward move from the $278 high to $209 low is also near the $244 zone to act as a strong hurdle for the bulls. Therefore, a successful break above the 55 SMA and the $244 resistance could open the doors for a decent recovery in the coming sessions.
The next major hurdle is seen near the $260 area. Conversely, the price might struggle to clear the 55 SMA and the $244 resistance. In the stated bearish case, the price could resume its decline towards the $220 and $210 support levels in the near term.
Looking at the chart, Ethereum price is showing a few positive signs above the $225 zone. However, a clear break above the $235 and $244 levels is must for upside continuation.
Technical indicators
4 hours MACD – The MACD for ETH/USD is currently gaining momentum in the bullish zone.
4 hours RSI (Relative Strength Index) – The RSI for ETH/USD is now above the 50 level.
Key Support Levels – $225, followed by the $210 zone.
Key Resistance Levels – $235 and $244.


Leave a Reply
You must be logged in to post a comment.