- Ethereum price failed to gain momentum above $270 and declined sharply against the US Dollar.
- ETH price is under pressure but there are many important supports on the downside near $230.
- There is a key bearish trend line in place with resistance near $260 on the 4-hours chart (data feed from Coinbase).
- The price must stay above the $230 level to remain in the positive zone.
Ethereum price failed to continue higher above $270 and $280 against the US Dollar. ETH is likely to consolidate above $230 before it could make the next move.
Ethereum Price Analysis
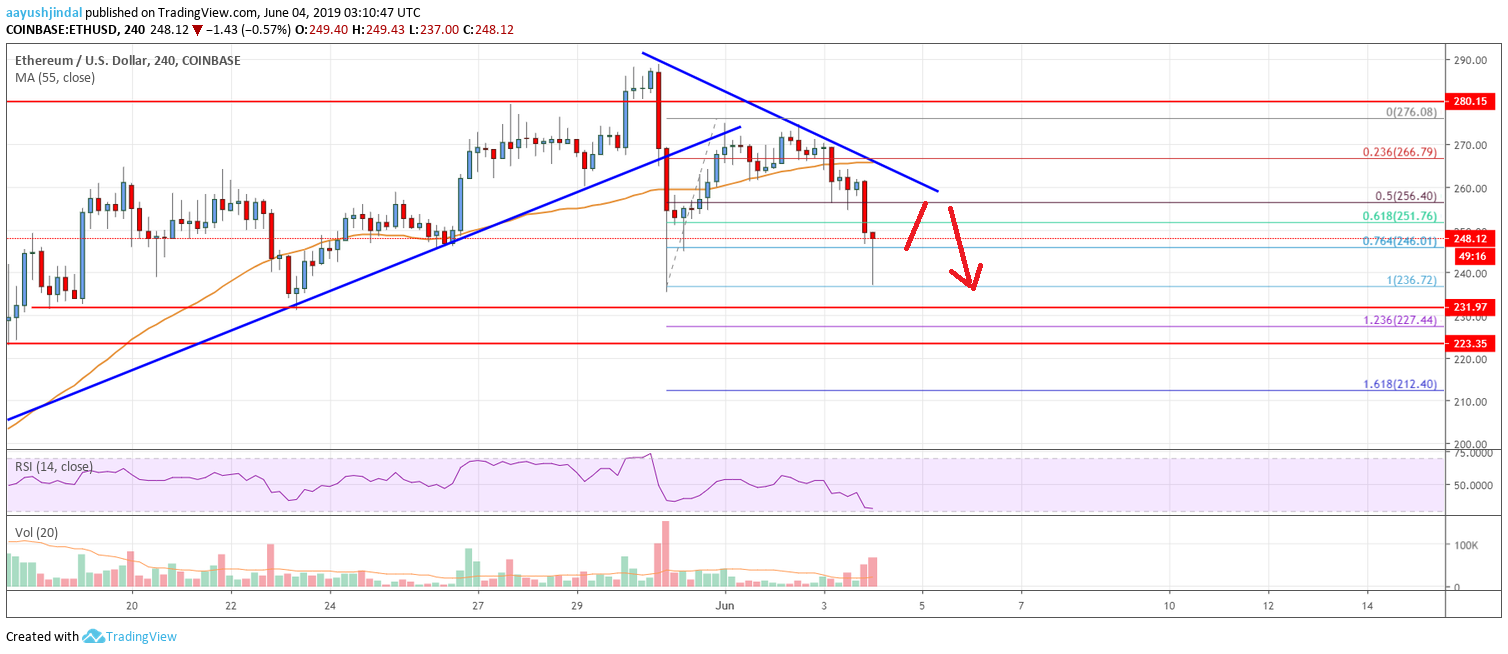
After a strong decline, Ethereum price corrected above the $250 level against the US Dollar. The ETH/USD pair even broke the $260 level and the 55 simple moving average (4-hours). However, the pair struggled to gain momentum above the $270 resistance level. It started a fresh decline below the $260 support and the 55 simple moving average (4-hours). There was a sharp dip below the 50% Fib retracement level of the upside wave from the $236 swing low to $276 swing high.
The decline was sharp since the price even cleared the $240 support area. It traded close to the $236 swing low and it is currently correcting higher. On the upside, there are a few key hurdles near the $250 and $260 levels. There is also a major bearish trend line formed with resistance near $260 on the 4-hours chart. If there is an upside correction, the price is likely to struggle near $255 or $260. Moreover, the 25 SMA is also positioned near the $260 level to act as a barrier for the bulls.
On the downside, an initial support is near the $236 swing low. If there is a downside break below $236, the price could start a fresh decline below $230. The next key support is near the 1.236 Fib extension level of the upside wave from the $236 swing low to $276 swing high. If the bulls fail to protect the $225 support, there could be heavy losses.

Looking at the chart, Ethereum price is clearly trading above the key $230 support area. If there are additional losses, the price may even trade towards the $210 level. The 1.618 Fib extension level of the upside wave from the $236 swing low to $276 swing high is also near the $212 level. On the upside, the main hurdles are near the $255 and $260 levels.
Technical indicators
4 hours MACD – The MACD for ETH/USD is currently losing momentum in the bearish zone.
4 hours RSI (Relative Strength Index) – The RSI for ETH/USD is currently well below the 40 level.
Key Support Levels – $235, followed by the $225 zone.
Key Resistance Levels – $255 and $260.


Leave a Reply
You must be logged in to post a comment.