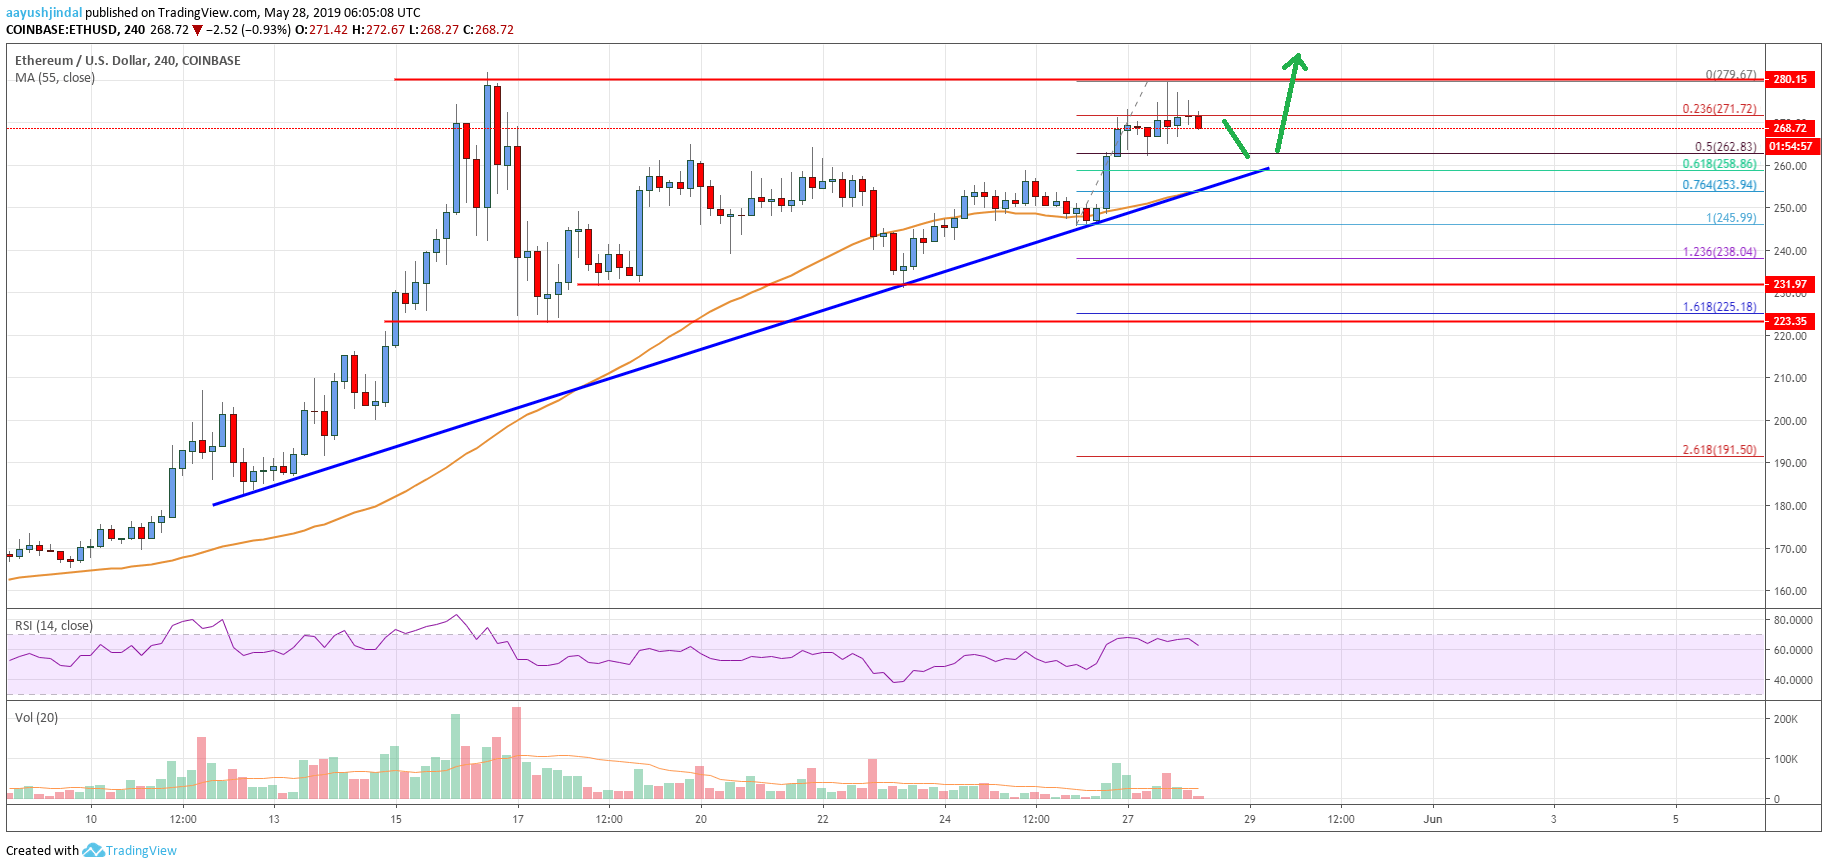
- Ethereum price climbed steadily after testing the $231 and $232 supports against the US Dollar.
- ETH price broke the $262 resistance area, but it is struggling to clear the $280 resistance.
- There is a key bullish trend line in place with support at $258 on the 4-hours chart (data feed from Coinbase).
- The price is likely to surge once it clears the main $280 resistance level in the near term.
Ethereum price is trading nicely in an uptrend above $260 against the US Dollar. ETH is likely to surpass the $280 barrier and accelerate towards the $300 and $320 resistances.
Ethereum Price Analysis
This past week, Ethereum price corrected lower below the $250 support against the US Dollar. The ETH/USD pair retested the main $231 and $232 support levels, where the bulls emerged. A swing low was formed near $231 and the price started a fresh increase. There was a break above the $250 and $254 resistance levels. The price even broke the key $262 resistance and the 55 simple moving average (4-hours). It opened the gates for more upsides above the $270 level.
ETH traded towards the main $280 resistances, where sellers protected further gains. A swing high was formed recently near $276 and the price is currently correcting lower. It is trading below the $272 level and the 23.6% Fib retracement level of the recent wave from the $246 swing low to $279 swing high. On the downside, there are many key supports near the $262 and $260 levels. The 50% Fib retracement level of the recent wave from the $246 swing low to $279 swing high is also near $262 to act as a strong support.
Moreover, there is a key bullish trend line in place with support at $258 on the 4-hours chart. The trend line support coincides with the 61.8% Fib retracement level of the recent wave from the $246 swing low to $279 swing high. Therefore, if the price corrects lower, it is likely to find a strong support near the $262 or $258 level. On the upside, the main hurdles are near $278 and $280.

Looking at the chart, Ethereum price is trading nicely above the $258 support level. The current price action indicates a minor decline before the bulls attempt to clear the key $280 resistance area. A successful break above the $280 barrier is likely to set the pace for more gains above $300 and $320.
Technical indicators
4 hours MACD – The MACD for ETH/USD is currently losing momentum in the bullish zone.
4 hours RSI (Relative Strength Index) – The RSI for ETH/USD is correcting lower towards the 60 level.
Key Support Levels – $262, followed by the $258 zone.
Key Resistance Levels – $280 and $300.


Leave a Reply
You must be logged in to post a comment.