- Ethereum price surged higher and broke the key $178 resistance area against the US Dollar.
- ETH even cleared the $200 resistance level, opening the doors for more gains.
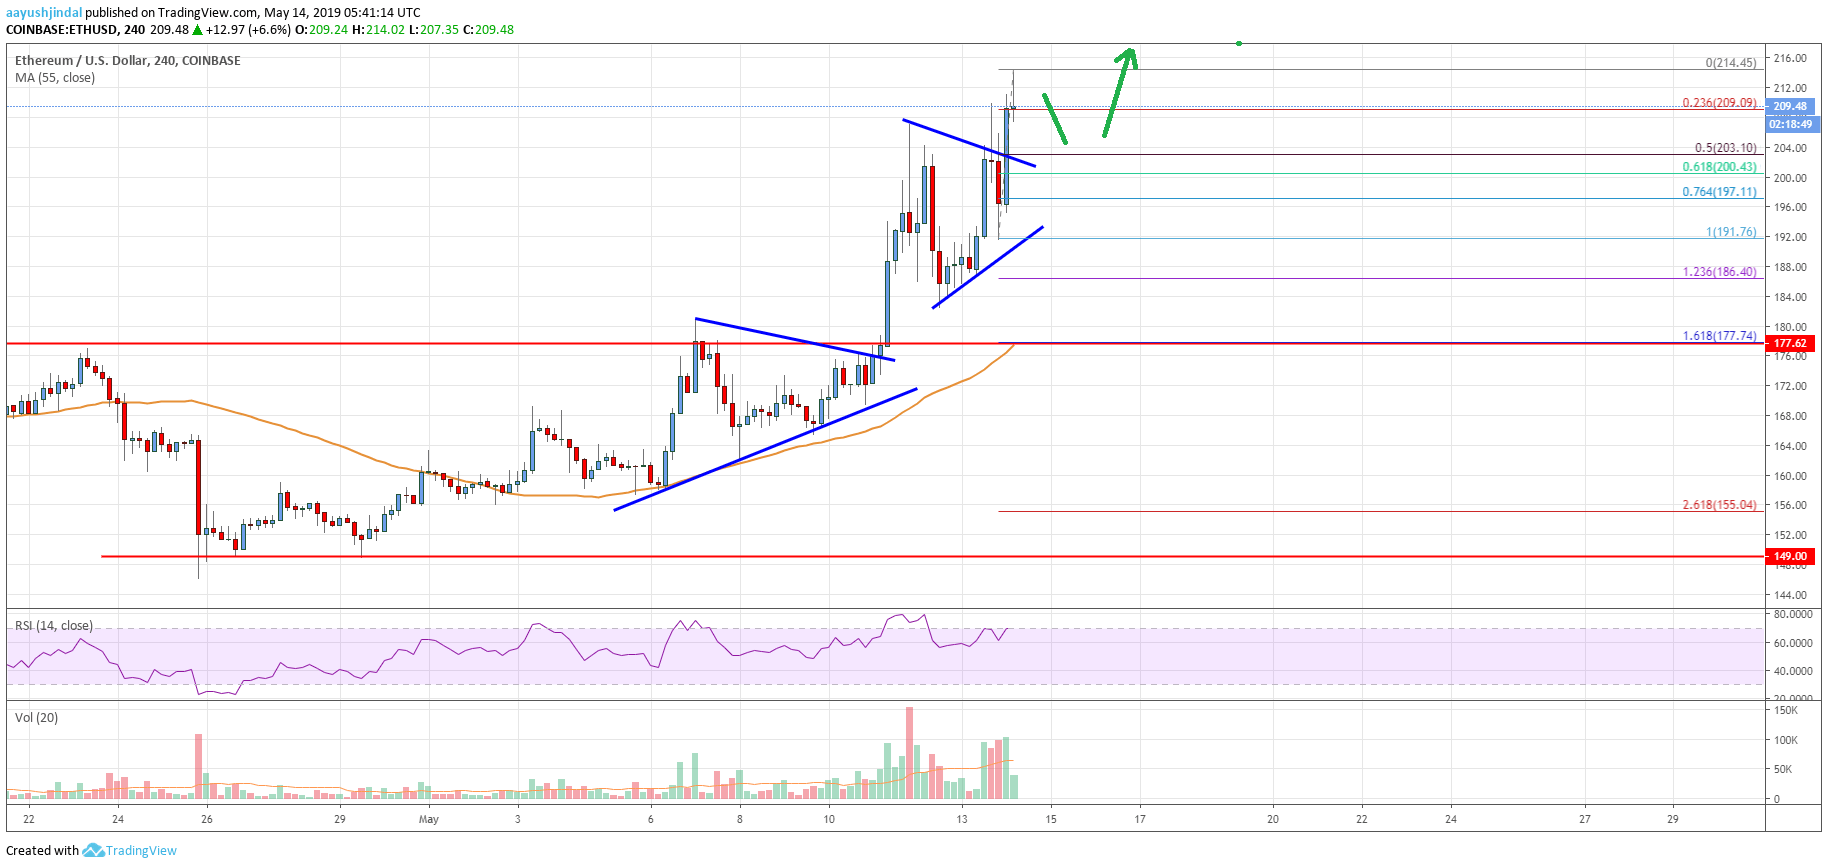
- There was a break above a couple of bullish breakout patterns near $176 and $203 on the 4-hours chart (data feed from Coinbase).
- The price could continue to move higher towards the $220, $225 and $240 levels in the near term.
Ethereum price started a strong upward move above $178 and $200 against the US Dollar. ETH is following bitcoin and it could continue to surge towards $220 and $240 in the coming days.
Ethereum Price Analysis
This past week, Ethereum price started a fresh rally above the $178 and $180 resistances against the US Dollar. The ETH/USD pair gained bullish momentum above $180 and the 55 simple moving average (4-hours). The pair surged more than 15% and broke the $185 and $194 resistance levels. Finally, there was a clear break above the $200 barrier. Recently, bitcoin price gained heavily above $7,500, opening the doors for solid gains in ETH.
During the recent rise, there was a break above a couple of bullish breakout patterns near $176 and $203 on the 4-hours chart. The pair traded as high as $214 recently and it is currently consolidating gains. An immediate support is at $208 and the 23.6% Fib retracement level of the recent wave from the $191 swing low to $214 high. The main support is near the $203 level (the recent triangle break zone). It also coincides with the 50% Fib retracement level of the recent wave from the $191 swing low to $214 high.
In the short term, the price may dip towards $208 or $203. However, dips remains supported and the price is likely to bounce back above $210 and $215. A clear break above the $215 level could push the price towards the $225 level. The next key resistance is near the $240 level, where sellers are likely to appear. On the downside, the key support is near $198 and the 76.4% Fib retracement level of the recent wave from the $191 swing low to $214 high.

Looking at the chart, Ethereum price is currently in a strong uptrend above $203 and $200. The bulls are likely to attempt a break above the $215 level in the short term. If they succeed, the next stop could be $225 or $240.
Technical indicators
4 hours MACD – The MACD for ETH/USD is currently gaining momentum in the bullish zone.
4 hours RSI (Relative Strength Index) – The RSI for ETH/USD is well above the 60 level and is moving higher.
Key Support Levels – $203, followed by the $196 zone.
Key Resistance Levels – $215 and $225.


Leave a Reply
You must be logged in to post a comment.