- Ethereum price rallied recently above the $165 and $170 resistance levels against the US Dollar.
- ETH tested the $180 resistance level and it is currently trading with a strong bullish bias.
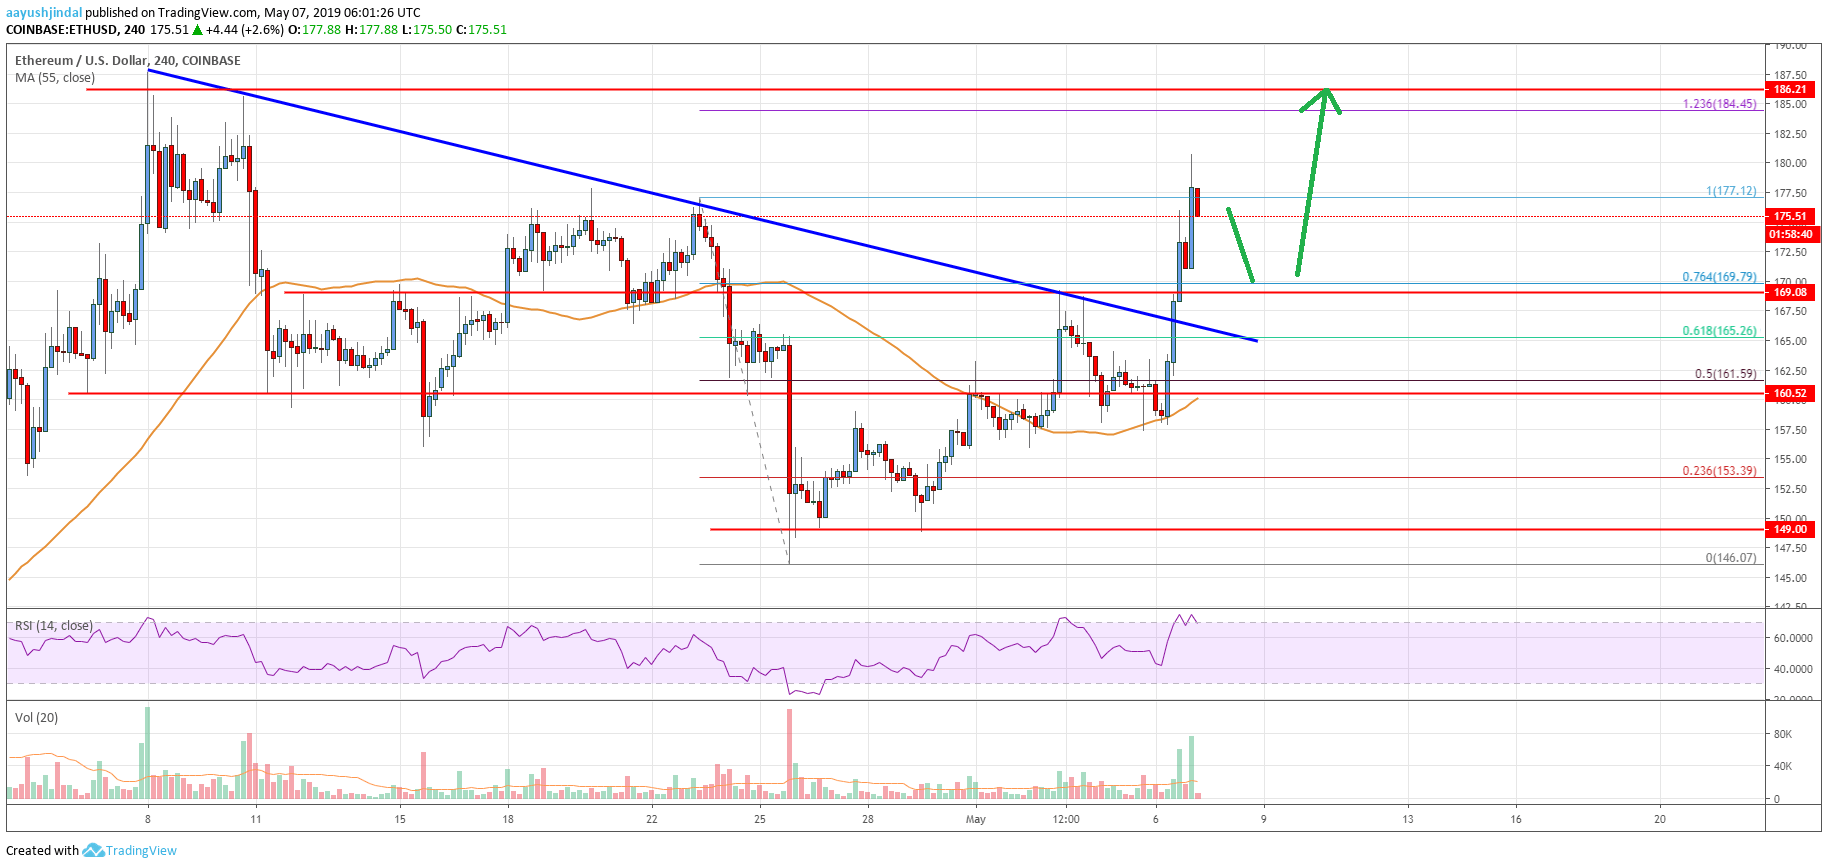
- There was a break above a major bearish trend line with resistance near $167 on the 4-hours chart (data feed from Coinbase).
- The price could continue to move higher towards the $188, $192 or even $195 resistance.
Ethereum price started a strong rally above the $170 resistance against the US Dollar. ETH is likely to remain in an uptrend and it could extend gains above $180 and $185.
Ethereum Price Analysis
This past week, there was a downside extension below $160 in Ethereum price against the US Dollar. The ETH/USD pair even broke the $155 support level and spiked towards the $145 level. A swing low was formed near the $146 level and recently the price corrected higher. It broke the $155 and $160 resistances to move into a positive zone. There was also a break above the 50% Fib retracement level of the main decline from the $177 high to $146 low.
More importantly, there was a close above the $165 level and the 55 simple moving average (4-hours). Finally, there was a break above a major bearish trend line with resistance near $167 on the 4-hours chart. The pair recently rallied above the $175 resistance, and the 76.4% Fib retracement level of the main decline from the $177 high to $146 low. It is currently trading near the $177-180 resistance zone. In the short term, there could be a minor dip, but the price remains supported above $172 and $170.
On the upside, a clear break above the $180 resistance may push the price towards the $188 level. An intermediate resistance is near $185, and the 1.236 Fib extension level of the main decline from the $177 high to $146 low. Above $185 and $188, the price is likely to climb towards the $195 and $200 resistance levels in the near term.

Looking at the chart, Ethereum price clearly breached a few important resistances near $170 to move into a positive zone. If there is a downside correction, the bulls are likely to defend the $170 support area. The next key support is near $160 and the 55 simple moving average (4-hours). Only a close below $160 might negate the current bullish view and push the price towards $150.
Technical indicators
4 hours MACD – The MACD for ETH/USD is currently gaining pace in the bullish zone.
4 hours RSI (Relative Strength Index) – The RSI for ETH/USD jumped higher above 60 and it is currently near 70.
Key Support Levels – $172, followed by the $170 zone.
Key Resistance Levels – $180 and $188.


Leave a Reply
You must be logged in to post a comment.