- Tron price started a strong rally after it broke the key $0.0292 resistance area against the US Dollar.
- TRX price surged more than 12% and traded above the $0.0320 and $0.0350 levels.
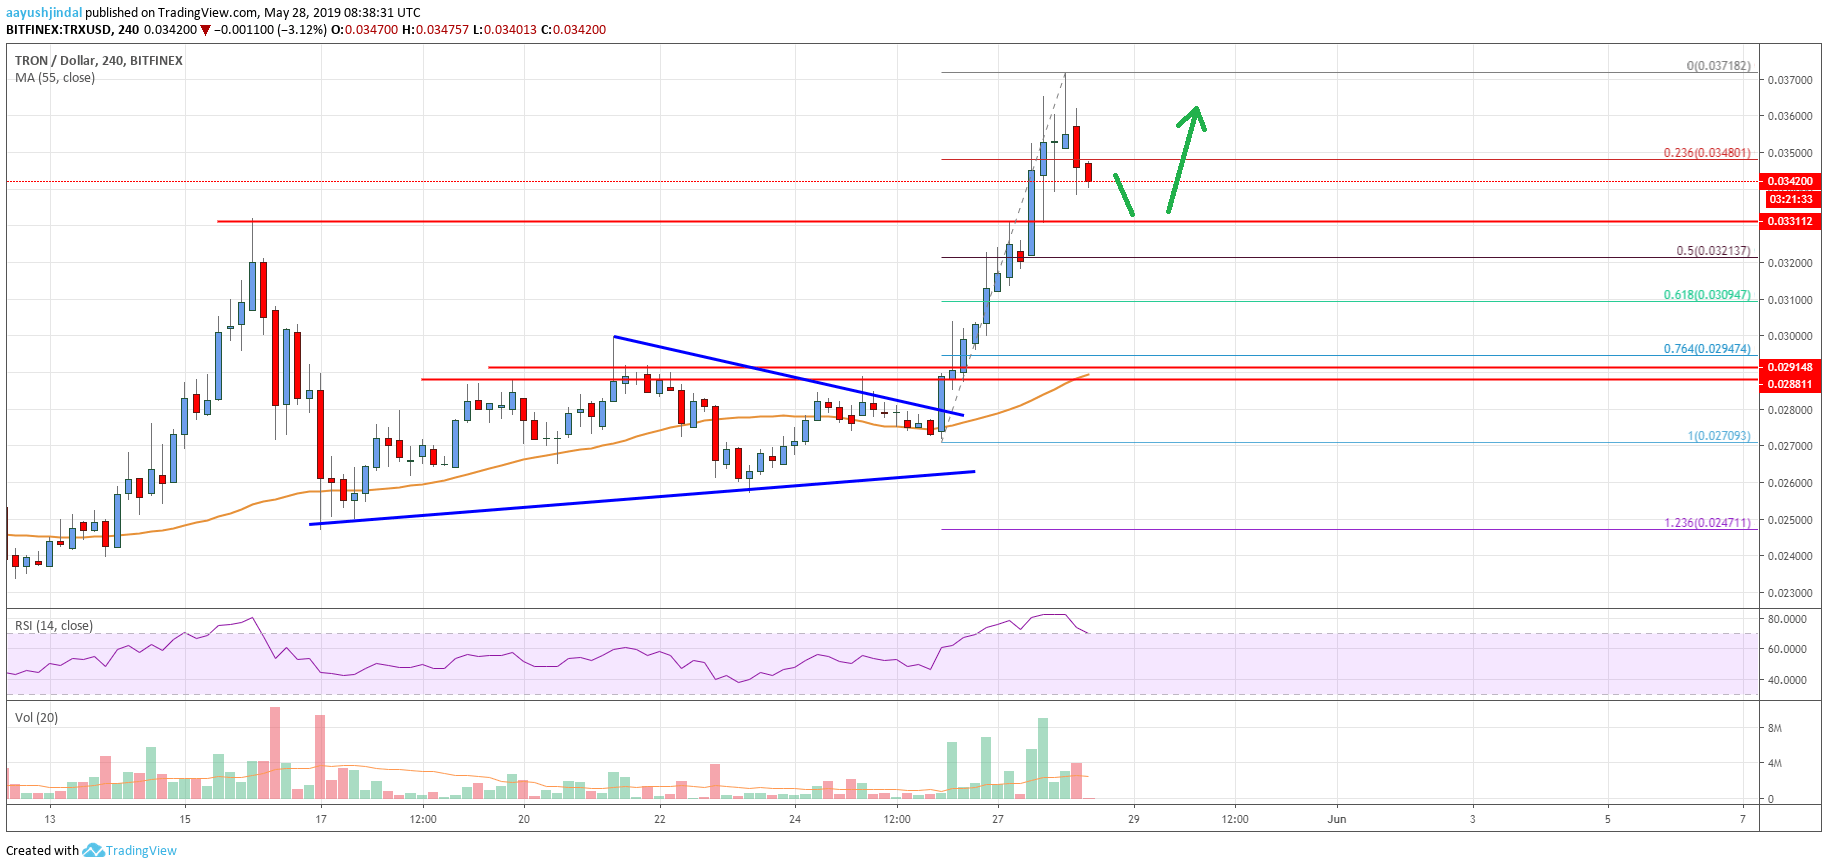
- There was a break above a crucial contracting triangle with resistance near $0.0280 on the 4-hours chart (data feed via Bitfinex).
- The price traded as high as $0.0371 and it is currently correcting lower towards the $0.0331 support.
TRON price recently jumped higher significantly against the US Dollar and bitcoin. TRX traded close to $0.0380 and it is currently correcting lower towards a couple of important buy zones.
Tron Price Analysis
This past week, there were range moves in TRON price above the $0.0250 and $0.0260 supports against the US Dollar. The TRX/USD pair formed a solid support base above $0.0260 and slowly traded above $0.0280. There was a close above the $0.0290 level and the 55 simple moving average (4-hours). It opened the doors for a solid upward move above the $0.0295 and $0.0300 resistance levels.
Moreover, there was a break above a crucial contracting triangle with resistance near $0.0280 on the 4-hours chart. The price gained momentum above the $0.0320 and $0.0350 resistance levels. Finally, there was a break above the $0.0365 level and the price traded to a new weekly high at $0.0371. Recently, there was a downside correction below $0.0365 and the 23.6% Fibonacci retracement level of the last wave from the $0.0270 low to $0.0371 high. TRX price is currently trading below the $0.0348 level, but there are many supports on the downside.
An immediate support is near $0.0331 (the previous resistance area). If there is an extended decline, the price may perhaps test the $0.0321 support area. Besides, the 50% Fibonacci retracement level of the last wave from the $0.0270 low to $0.0371 high is also near the $0.0321 level. Therefore, if there is a downside correction, the price is likely to find a strong buying interest near the $0.0331 support or the $0.0321 level.

The chart indicates that TRX price moved sharply into a positive zone above the $0.0320 and $0.0330 levels. There could be downsides in the short term, but the price is likely to stay above $0.0320. Once the current correction is complete, the price could start a fresh increase above $0.0365. In the mentioned case, the price might surpass $0.0380 and $0.0400.
Technical Indicators
4 hours MACD – The MACD for TRX/USD is slowly losing momentum in the bullish zone.
4 hours RSI – The RSI for TRX/USD is currently correcting lower from the overbought zone towards the 65 level.
Key Support Levels – $0.0331 and $0.0321.
Key Resistance Levels – $0.0365, $0.0380 and $0.0400.


Leave a Reply
You must be logged in to post a comment.