
More Crypto Online flags $FET’s upside as a 3-wave corrective advance on the 4H chart. A 5-wave impulse is still missing. Pure TA, not financial advice.
The price moved. That part nobody disputes.
What the chart is saying about that move is something else. $FET has pushed to the upside on the 4-hour timeframe, but the Elliott Wave structure underneath it has not changed the reading in any meaningful way.
According to More Crypto Online on X, there has been no major change since the last update. The move higher still appears corrective. Three waves. That is all the chart has produced so far.
Three Waves Do Not Make a Trend
A corrective advance is not the same as a new leg up. It looks like one. The price goes higher, the chart looks better, but the structure underneath it tells a different story.
The 4H FET/USD chart from More Crypto Online carries a dual-scenario Elliott Wave overlay. The blue scenario marks out a potential circle wave C. That is the bullish path. But as More Crypto Online noted on X, only a clear 5-wave move to the upside would provide stronger confirmation that circle wave C has actually started.
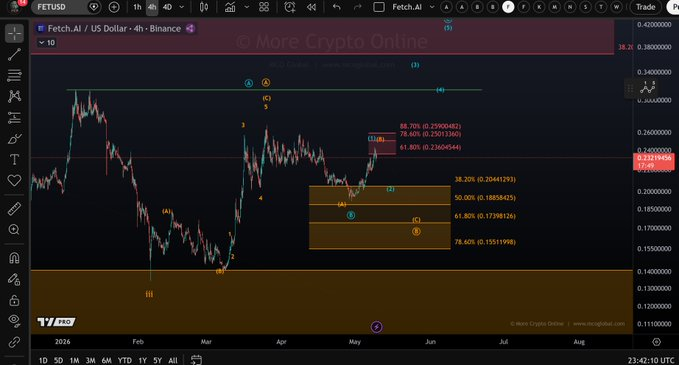
Source: Morecryptoonl
Right now, the advance has only developed as a 3-wave sequence. That matters.
What the Fibonacci Levels Show
The chart shows Fibonacci retracement levels stacked between current price and the prior highs. The 61.80% level sits near $0.236. Above that, 78.60% comes in around $0.259 and 88.70% at roughly $0.259 to $0.290 on the extension cluster.
On the downside, the orange support box on the chart maps retracements from the prior swing. The 38.20% level sits near $0.204. Below that, 50% comes in around $0.188. The 61.80% retracement, deeper in the box, lands near $0.174.
FET was trading around $0.231 at the time of writing. It is sitting between those two zones.
The Corrective Label Still Holds
A 3-wave advance after a downtrend is a standard corrective structure. It does not rule out further upside. What it does is leave the bullish case unconfirmed.
More Crypto Online on X put it plainly. The structure needs to shift. Five waves up, not three. Until that prints, the corrective label stays on the chart.
The blue scenario gives FET a path to reclaim higher ground through a wave C advance. That wave C, if it begins, would represent a significant move from current levels. The prior wave structure on the chart suggests wave C could target the upper range of the box. That level has not been touched since March.
What the bulls need is impulse. Not consolidation. Not another three-wave wiggle upward.
The chart has the setup drawn. The price just has to show up differently.
Disclaimer: This article is based on technical analysis sourced from More Crypto Online on X and represents the analyst’s interpretation only. It does not constitute financial or investment advice. Always conduct independent research before making any trading decisions.


Leave a Reply
You must be logged in to post a comment.