
HBAR trades near $0.09060 as ETF inflows top $99.07M and 15 more HBAR funds await SEC review near key resistance.
HBAR gained renewed ETF-related interest after claims of more than $99.07 million in cumulative inflows and 15 additional HBAR ETFs awaiting SEC review.
The token traded near $0.09060 on Coinbase, while technical levels showed a key resistance area near $0.10113.
HBAR ETF Activity Draws Market Attention
HBAR has seen renewed interest as ETF-related data circulates across the market. Reports cited cumulative inflows of more than $99.07 million into HBAR-linked products.
The same data also stated that the Canary HBAR ETF holds about 1.45% of total supply. This figure has become a key point for traders tracking institutional demand.
$HBAR To $1? The ETF Data Nobody Wants You To See 🤫 🚀
While Retail Sleeps, Smart Money Accumulates:
✅ Cumulative Inflows: $99.07M+
✅ Canary ETF Holds ~1.45% Of Supply
✅ 15 More HBAR ETFs Pending SECEvery $ Of ETF Inflow = Forced Buying On Open Market 🔥
Accumulation… pic.twitter.com/uuRf1hRQmw
— Crypto Patel (@CryptoPatel) May 7, 2026
Market participants are also watching 15 more HBAR ETFs reportedly awaiting SEC approval. These pending products have added to the current HBAR ETF discussion.
ETF inflows can create direct market demand when funds need to hold the underlying asset. However, approval timelines remain subject to regulatory review.
HBAR Trades Below Key Fibonacci Resistance
HBAR traded near $0.09060 on the daily Coinbase chart. The token was down about 0.84% during the session.
The chart shows HBAR trading below the 1.0 Fibonacci level near $0.10113. This level remains an important resistance zone for short-term price action.
A daily close above $0.10113 could improve the market structure. It may also open a move toward $0.14226, which marks the 0.786 Fibonacci level.
Further resistance appears near $0.17456, $0.19724, and $0.21992. The upper Fibonacci range extends toward $0.24799 and $0.29335.
The reported accumulation zone sits between $0.073 and $0.043. A move into this range could draw attention from buyers watching lower support levels.
Read Also:
Hedera ETF Inflows Top $93M As Institutions Quietly Accumulate HBAR
Momentum Indicators Show Early Recovery
The MACD shows mild improvement on the daily chart. The MACD line is near 0.00021, while the signal line is close to minus 0.00002.
The histogram sits near minus 0.00023. This shows that momentum is improving, but the signal remains weak.
A stronger MACD move above the zero line could support a recovery attempt. Traders may watch this signal with the $0.10113 resistance level.
The RSI is near 53.44, while its moving average stands around 49.47. This places HBAR slightly above the neutral 50 level.
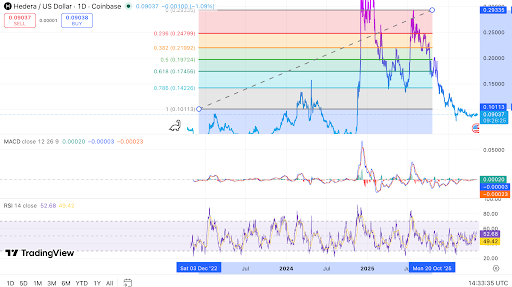
The RSI reading shows moderate buyer activity. It is still below the overbought area, so momentum has not reached an extreme level.
HBAR’s immediate support is near $0.085 to $0.090. A move below that area could bring the $0.080 level back into focus.
A deeper decline could move prices closer to the reported accumulation range. That range sits between $0.073 and $0.043.
The $1 target remains a long-range market claim rather than a confirmed chart level. Current technical resistance remains much lower, starting near $0.10113.
HBAR’s ETF narrative and chart structure remain linked in market discussion. Traders are watching SEC decisions, inflow data, and daily closing levels.


Leave a Reply
You must be logged in to post a comment.