
Hyperliquid’s HIP-3 open interest hits $2.47B, with Tradexyz at $2.33B and HYPE trading near $42.78 resistance.
Hyperliquid’s HIP-3 market reached a new record after daily open interest rose to $2.47 billion.
Tradexyz accounted for about $2.33 billion, or nearly 94% of the total. The surge came as HYPE traded near $42.78, close to a key resistance area on the daily chart.
Hyperliquid Records $2.47 Billion in HIP-3 Open Interest
Hyperliquid saw daily open interest in HIP-3 markets climb to $2.47 billion. Open interest measures active contracts that have not been closed.
Therefore, it can show how much money remains active in derivatives markets. Tradexyz held the largest share of HIP-3 activity.
Its open interest stood near $2.33 billion, based on the shared market figures. That amount represented nearly 94% of total HIP-3 open interest.
HIP-3 Daily OI just hit $2.47 BILLION!
Tradexyz alone is sitting at $2.33B (~94% of total).
Open Interest has been exploding in 2026.
Biggest concentration of liquidity we’ve seen on Hyperliquid so far.Massive leverage + monster capital flowing in.
Who’s all-in on HIP-3?… pic.twitter.com/bn8MQei3JS
— Hyperliquid Hub (@Hyperliquid_Hub) May 17, 2026
The data points to a strong rise in trading activity during 2026. More capital appears to be moving through HIP-3 markets as demand grows.
However, high open interest can also lead to faster moves during liquidations.
This level marks the largest known liquidity concentration on Hyperliquid so far. It also shows the growing role of HIP-3 within the platform.
Traders are now watching whether this activity can remain steady.
HYPE Price Moves Near Daily Resistance
HYPE traded around $42.78 on the daily chart. The token gained about 2.33% during the session shown.
Meanwhile, price moved close to resistance between $43 and $45.
The chart shows that HYPE had earlier rallied toward $55 to $60. After that move, the market corrected and found support near $22 to $25.
Since then, price has recovered and formed higher levels. A daily close above $45 would be watched by traders.
Such a move could bring the $48 to $50 area into view. The larger resistance zone still remains near $55 to $60.
Support is also clear on the daily chart. The nearest support area sits between $40 and $41. If that zone holds, the short-term recovery structure may remain intact.
Read Also:
HYPE Price in Focus as CME and NYSE Push Hyperliquid Regulation
Momentum Data Shows Mixed Setup
Momentum indicators showed a mixed picture as price approached resistance. The MACD line was near 0.432.
The signal line was near 0.451, while the histogram was slightly negative. This setup suggests that momentum has not fully turned stronger.
Still, the indicator has not shown a sharp bearish shift. A fresh crossover could support another attempt above resistance.
The RSI was near 53, with its average around 54. This places HYPE in a neutral zone. As a result, the chart does not show overbought conditions at current levels.
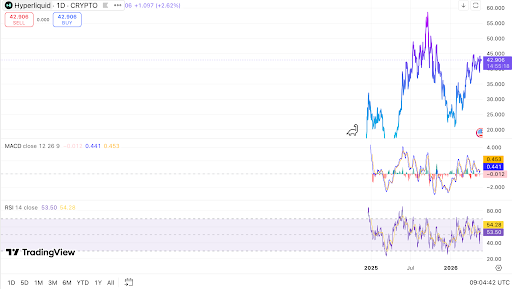
A move above 60 on the RSI may show stronger buying pressure. A drop below 45 could suggest weaker demand.
For now, price action near $43 to $45 remains the key area. The open interest record adds another factor for traders to monitor.
High leverage can support liquidity, and it can also raise market risk. Therefore, HIP-3 activity and HYPE price levels may remain closely watched.


Leave a Reply
You must be logged in to post a comment.