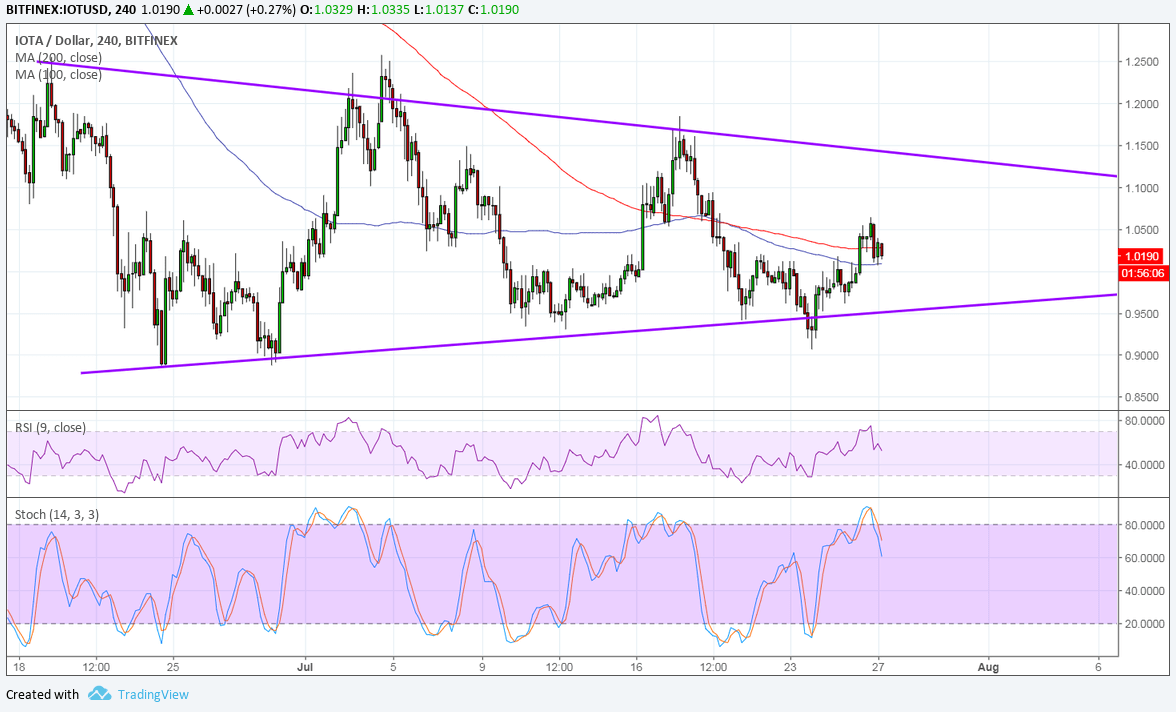
IOTA has formed lower highs and higher lows to trade inside a symmetrical triangle consolidation pattern on its 4-hour time frame. Price is gaining some traction off its bounce from support and may be eyeing the top once more.
However, the 100 SMA is below the longer-term 200 SMA to indicate that the path of least resistance is to the downside. This suggests that support is more likely to break than to hold. Then again, the gap between the moving averages is pretty narrow so this does not necessarily reflect a strong trend signal.
RSI is pointing down, however, also suggesting that sellers have the upper hand. Similarly stochastic is moving lower so IOTA could follow suit. A bit of bearish divergence can also be seen for this particular oscillator as it formed higher highs while price had lower highs. In that case, another test of support may be underway and sustained selling pressure could spur a break lower.
The chart pattern spans 0.8500 to 1.2000 so the resulting breakdown could be of the same height. If bulls take over, though, price could still test and break past the resistance at 1.1500 and lead to a rally of the same size.

While the cryptocurrency industry enjoyed a good run last week, it looks like profit-taking was just as swift, especially for bitcoin’s rivals. Most of the gains have been hogged by bitcoin as it dominated market capitalization and drew the spotlight in anticipation for the SEC decision on the bitcoin ETF.
There haven’t been much developments on the IOTA front, at least none covered by headlines as major updates. Remarks by CME CEO Duffy also weighed on some altcoins as he clarified that they’re not looking to introduce futures for other digital assets anytime soon.
And above all that, the return in demand for the dollar may have also dragged IOTUSD lower as traders look to the release of the US advanced GDP figure to gauge Fed tightening prospects.


