Tag: iotusd

IOTA Price Analysis: IOT/USD Strong Rally on Fujitsu Partnership
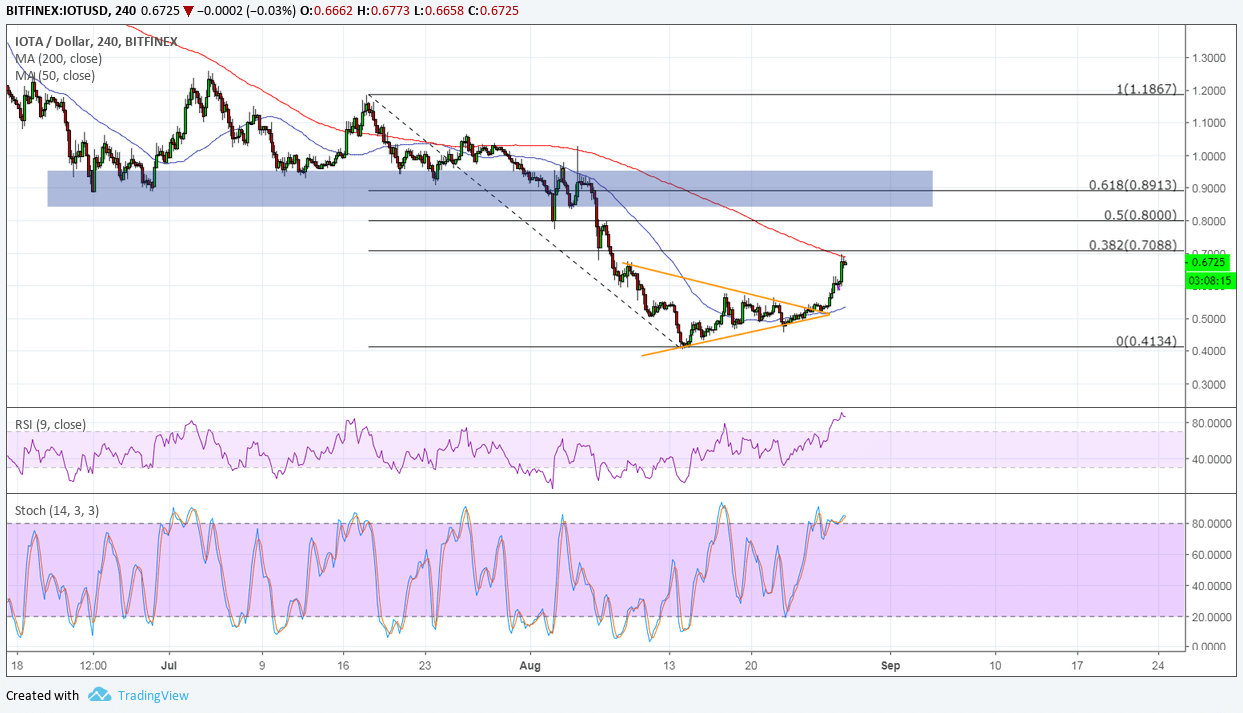
IOTA recently staged a strong upside break from a short-term triangle consolidation pattern. This ensued after the group struck a partnership with Japanese technology giant…

IOTA Price Analysis: IOT/USD Descending Triangle Pattern
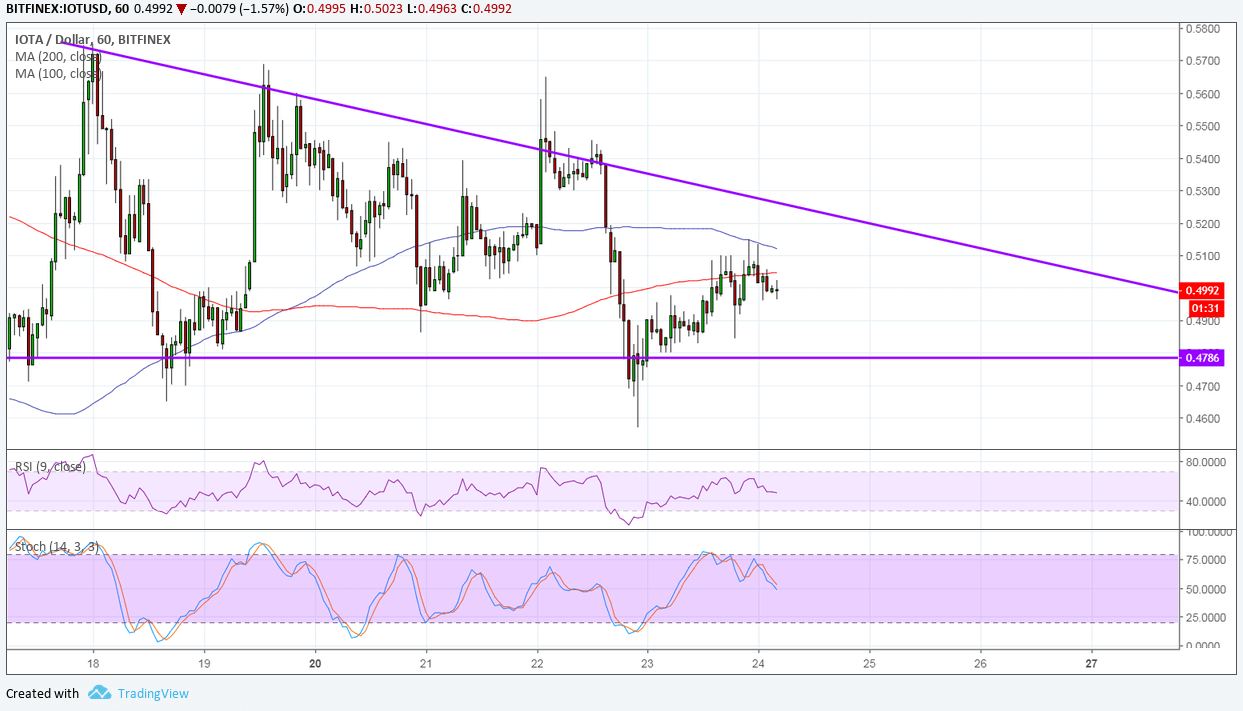
IOTA has formed lower highs and found support around 0.4800 to create a descending triangle pattern on its 1-hour chart. Price just bounced off support…

IOTA Technical Analysis – Retest of Broken Support?
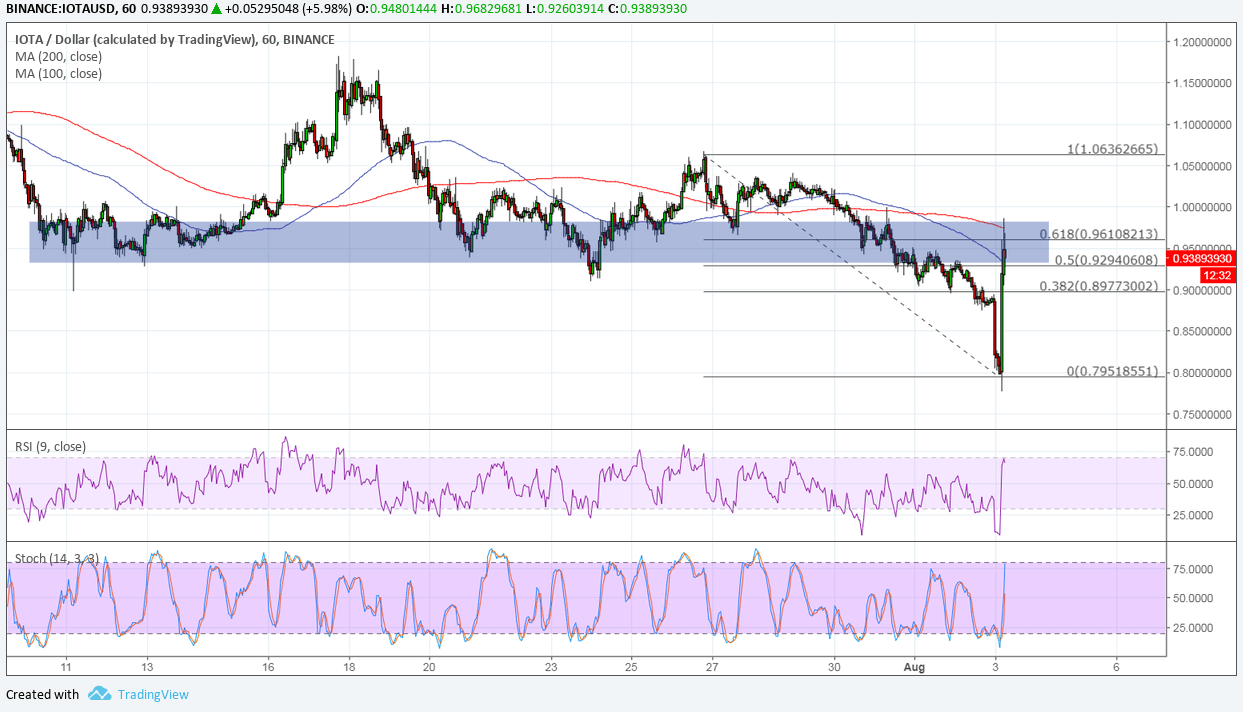
IOTA recently broke below support at the 0.9600 level then dipped to 0.8000 before pulling up. Price seems to be retesting the broken floor before…

IOTA Technical Analysis – Will Triangle Support Give Way?
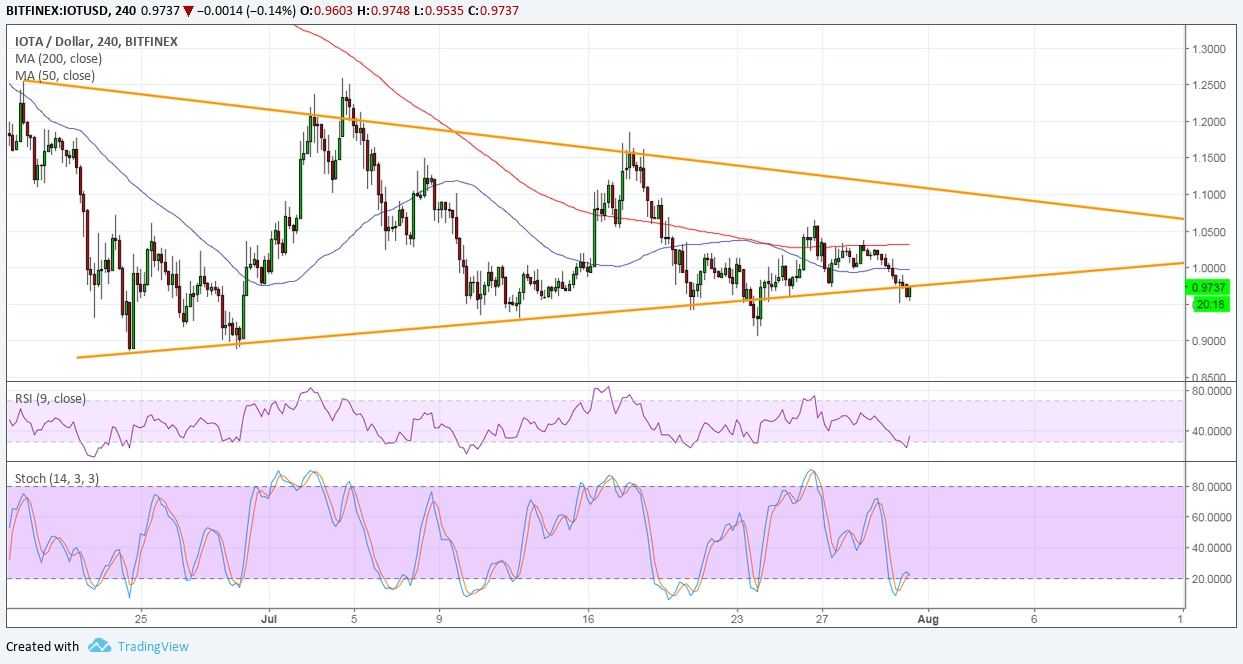
IOTA is currently testing the bottom of its symmetrical triangle and looks ready for a break below support. Technical indicators are looking mixed, though, as…

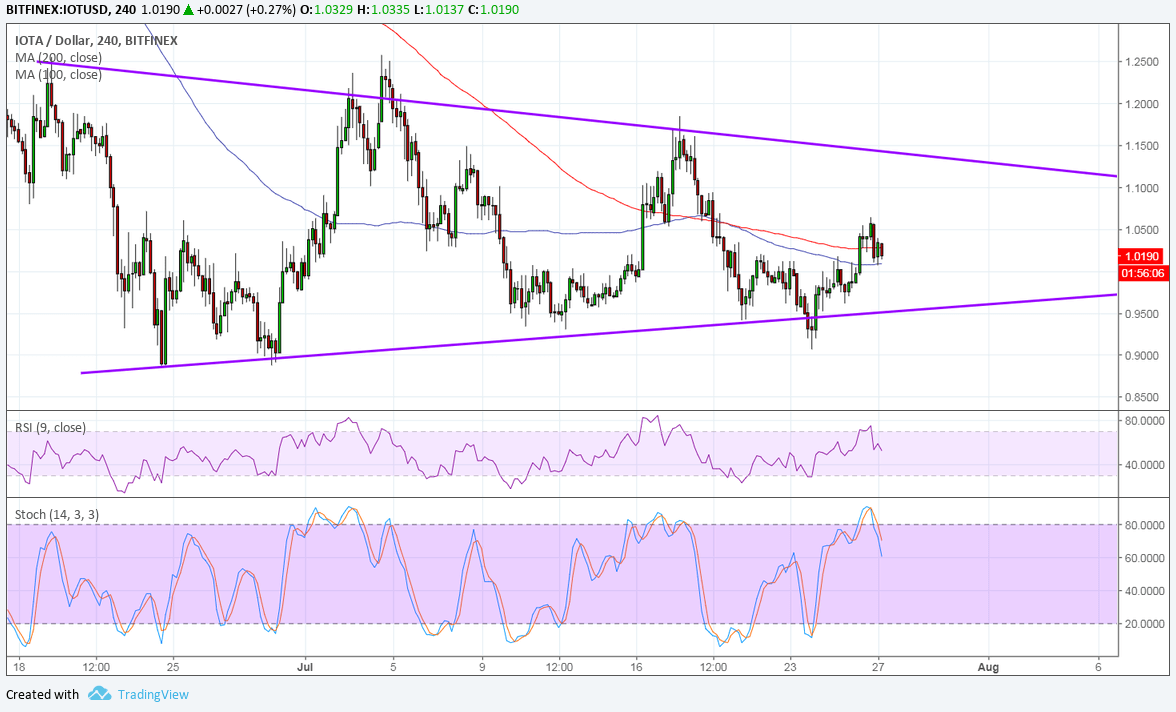
IOTA Technical Analysis – Triangle Consolidation Still Holding, Resistance Next
IOTA has formed lower highs and higher lows to trade inside a symmetrical triangle consolidation pattern on its 4-hour time frame. Price is gaining some…

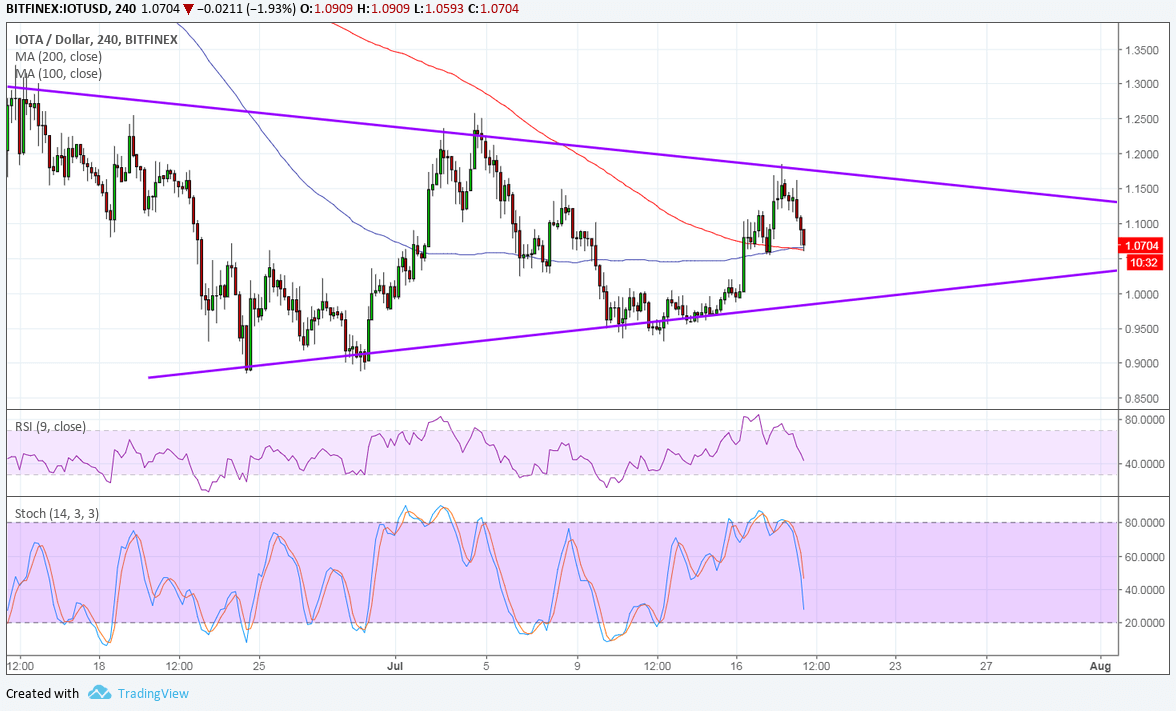
IOTA Technical Analysis for 07/19/2018 – Symmetrical Triangle In The Works
IOTA has formed lower highs and higher lows to create a symmetrical triangle pattern on its 4-hour chart. Price just bounced off the top and…
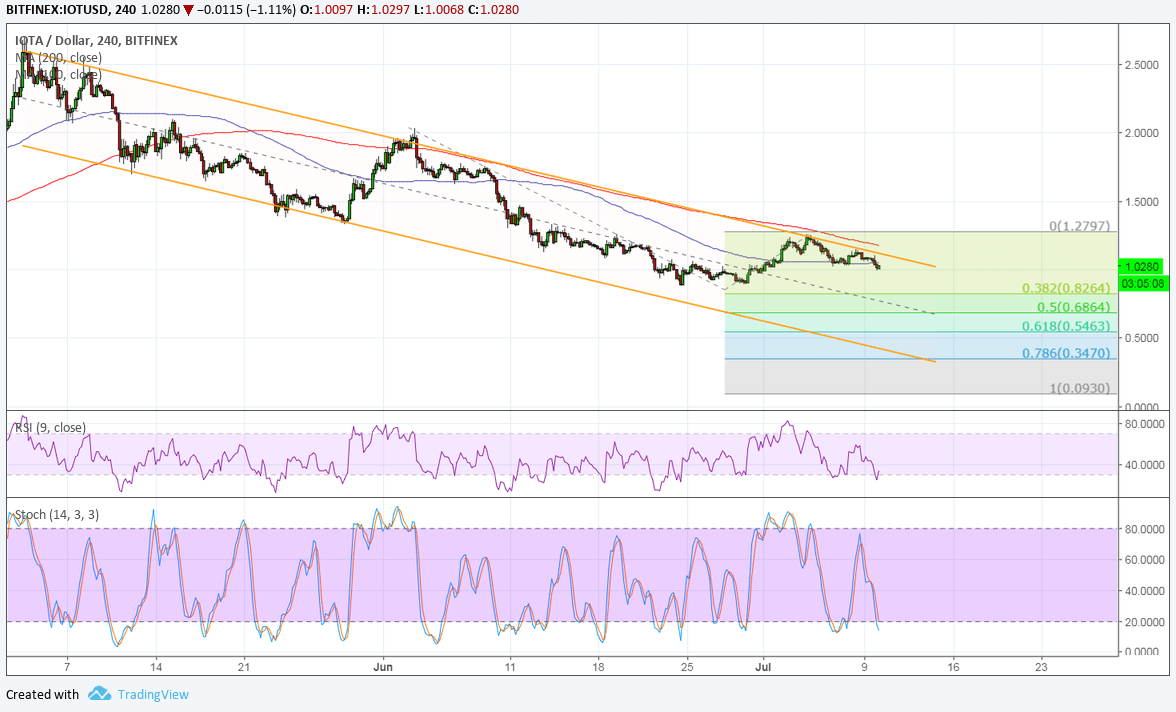
IOTA Technical Analysis for 07/10/2018 – Bearish Channel Action Resuming
IOTA looks ready to resume its selloff after bouncing off the top of its descending channel on the 4-hour chart. Applying the Fibonacci extension tool…
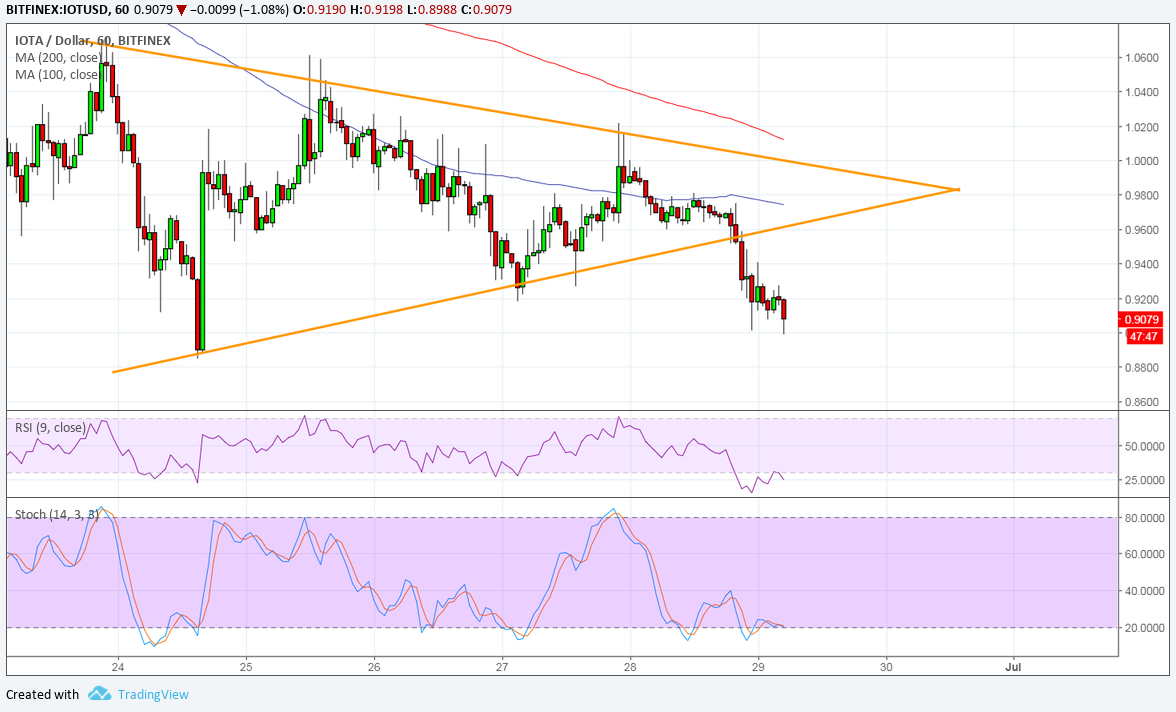
IOTA Technical Analysis for 06/29/2018 – Short-Term Triangle Break
IOTA broke down from its symmetrical triangle consolidation pattern to signal that further losses are in the cards. The chart pattern spans 0.8800 to 1.0600…

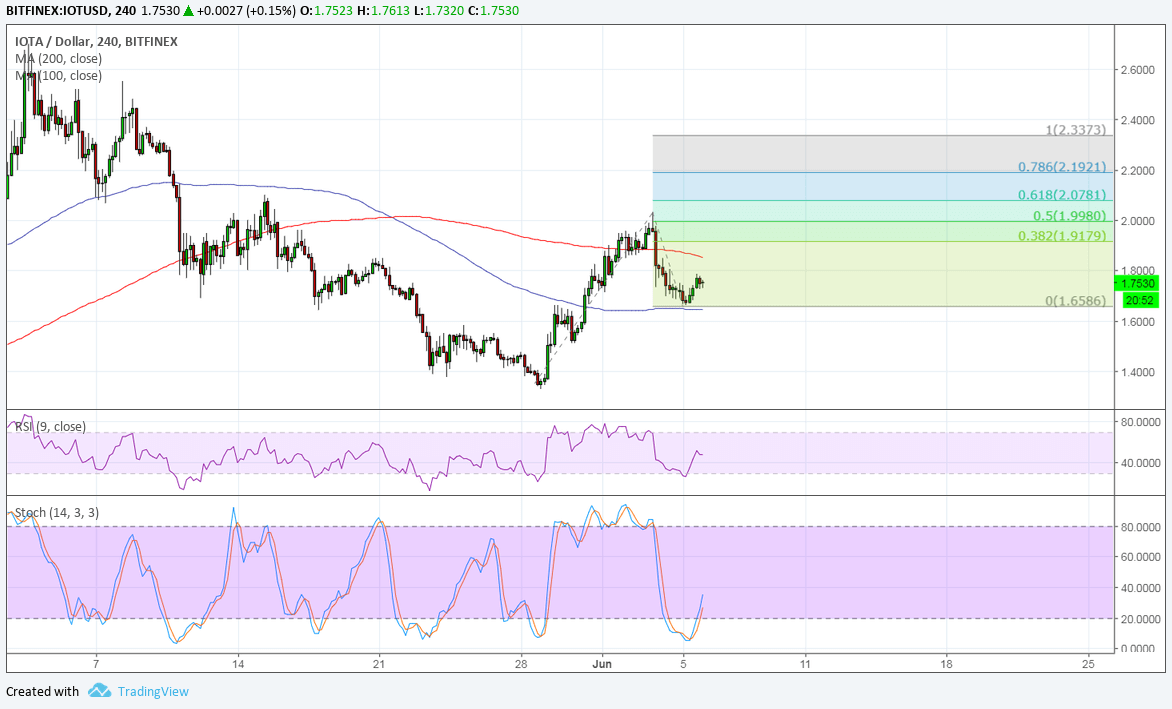
IOTA Technical Analysis for 06/06/2018 – Reversal Pattern Confirmation
IOTA appears to be completing a reversal pattern on its 4-hour time frame and could be due for a move to the extension levels next.…