
ASTER nears $0.62 support as RSI hits a three-month low, while liquidations show leveraged longs remain under pressure.
ASTER is under renewed selling pressure as the token slides toward the $0.62 support area.
The latest daily chart shows weakening momentum, while RSI has fallen to its lowest level in about three months.
Traders are now watching whether the expected work test brings a short bounce or opens the path toward the $0.55 liquidity zone.
ASTER Breaks Range Support as RSI Hits Three-Month Low
ASTER has started to break down after losing its recent range support. The move has placed the $0.62 wick in focus, as price continues to trade near the lower end of the structure.
Market analyst shared with the chart said, “ASTER beginning to break down aggressively.” The same view pointed to combined RSI reaching a three-month low.
The RSI reading is the weakest since the earlier $0.40 capitulation area. That weakness has developed after a loss of range support, not after a full market reset.
$ASTER beginning to break down aggressively.
Combined RSI at a 3-month low. Most negative read since the $0.40 capitulation. And that's just from a loss of range support.
I've been warning everyone about this move for weeks.
So there should be no surprises.
Position wise, we… pic.twitter.com/hlMRjdt5xw
— Ardi (@ArdiNSC) April 28, 2026
Positioning comments also pointed to a possible reaction near $0.62. The trader said ASTER remained “en route to hunt our $0.62 wick.”
A bounce may develop once that zone is reached. However, the same view said rallies may appear before price moves lower again.
The next area being watched is the $0.55 liquidity zone. That level may offer the next chance for ASTER to form a new range.
Daily Chart Shows Weak Momentum Below Resistance
ASTER traded near $0.643 on the daily chart. The token was slightly lower on the day, while recent candles showed a slow drift downward.
The broader structure remains weak after price failed near the $0.70 to $0.75 zone. Buyers pushed prices higher earlier, but they did not hold that area.
Immediate support sits near $0.625 to $0.643. A daily close below that band could increase pressure toward the $0.55 region.
Resistance is now seen near $0.67 to $0.69. ASTER would need to reclaim that zone to reduce near-term selling pressure.
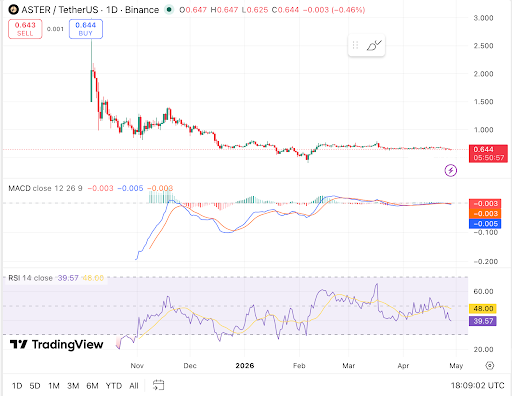
The MACD also shows weak momentum. The MACD line remains below the signal line, while the histogram is slightly negative.
The histogram reading is near -0.003. This shows that bearish momentum is present, although the move has not yet expanded sharply.
Read Also:
ASTER Whale Moves 34M Tokens to Aster as Price Slides and Losses Deepen Sharply
Long Positioning Adds Risk During the Slide
ASTER derivatives data show that traders still lean long across several measures. Binance account data is close to neutral, with a mild long bias.
Top trader positioning is stronger on the long side. Binance top trader positions showed a long-short ratio near 1.9048.
OKX account data also showed a high long-short ratio near 1.88. This suggests many active traders still expect a recovery.

However, liquidation data shows stress among leveraged long positions. Over 24 hours, total liquidations were near $595,100.
Long liquidations accounted for about $557,020 of that total. Short liquidations were much lower, near $38,090.
This setup creates a fragile market during support tests. If ASTER loses $0.62, clustered long exposure could add more downside pressure.
For now, traders are watching the $0.62 wick and the $0.55 liquidity zone. A move back above $0.69 would be needed to ease pressure.


Leave a Reply
You must be logged in to post a comment.