- Litecoin started a steady increase above $95 against the US Dollar.
- LTC price is now trading above $95 and the 55 simple moving average (4-hours).
- There was a break above a key contracting triangle with resistance at $92 on the 4-hours chart of the LTC/USD pair (data feed from Coinbase).
- The pair remains supported for more gains above the $100 and $105 resistance levels.
Litecoin price is showing positive signs above $95 against the US Dollar, similar to bitcoin. LTC price could climb further if there is a clear move above $105.
Litecoin Price Analysis
In the past few sessions, there was a strong increase in bitcoin, ethereum, ripple, and litecoin against the US Dollar. Earlier, LTC formed a base above the $90 level and started a fresh increase.
There was a clear move above the $94 and $95 resistance levels. During the increase, there was a break above a key contracting triangle with resistance at $92 on the 4-hours chart of the LTC/USD pair. The price even climbed above the $100 level and the 55 simple moving average (4-hours).
A high was formed near $103.78 and the price is now consolidating gains. On the upside, the price is facing resistance near the $104 and $105 levels.
A clear move above the $105 level could pump the price towards the $112 level. The next major resistance sits near the $120 level. Any more gains might send the price towards the $125 level.
On the downside, an initial support is near the $100 level. It is near the 23.6% Fib retracement level of the upward wave from the $88.25 swing low to $103.78 high. The first major support is near the $97.00 level. The next major support is near the $96 level.
The 50% Fib retracement level of the upward wave from the $88.25 swing low to $103.78 high is also near the $96 level. If there is a downside break below the $96 support, the price could accelerate lower towards the $92 level in the near term.
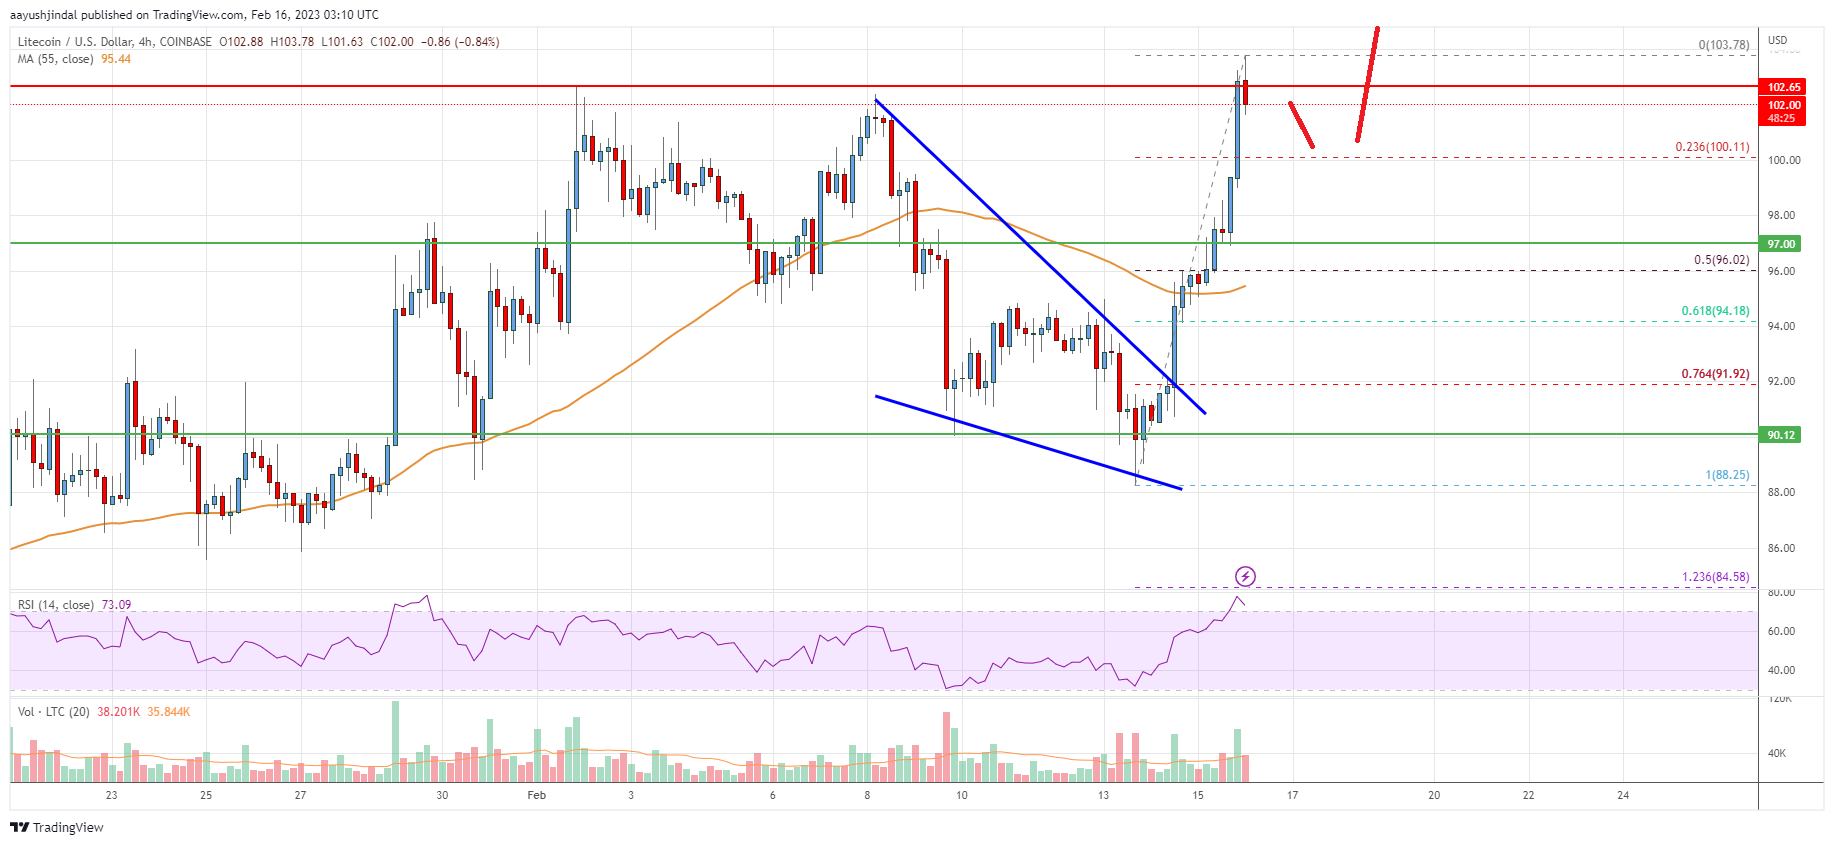
Looking at the chart, litecoin price is clearly trading above $100 and the 55 simple moving average (4-hours). Overall, the price remains supported for more gains above the $100 and $105 resistance levels.
Technical indicators
4 hours MACD – The MACD for LTC/USD is now gaining pace in the bullish zone.
4 hours RSI (Relative Strength Index) – The RSI for LTC/USD is now above the 50 level.
Key Support Levels – $97 and $96
Key Resistance Levels – $105 and $112.