
- Litecoin started a steady increase above $78 against the US Dollar.
- LTC price is now trading above $85 and the 55 simple moving average (4-hours).
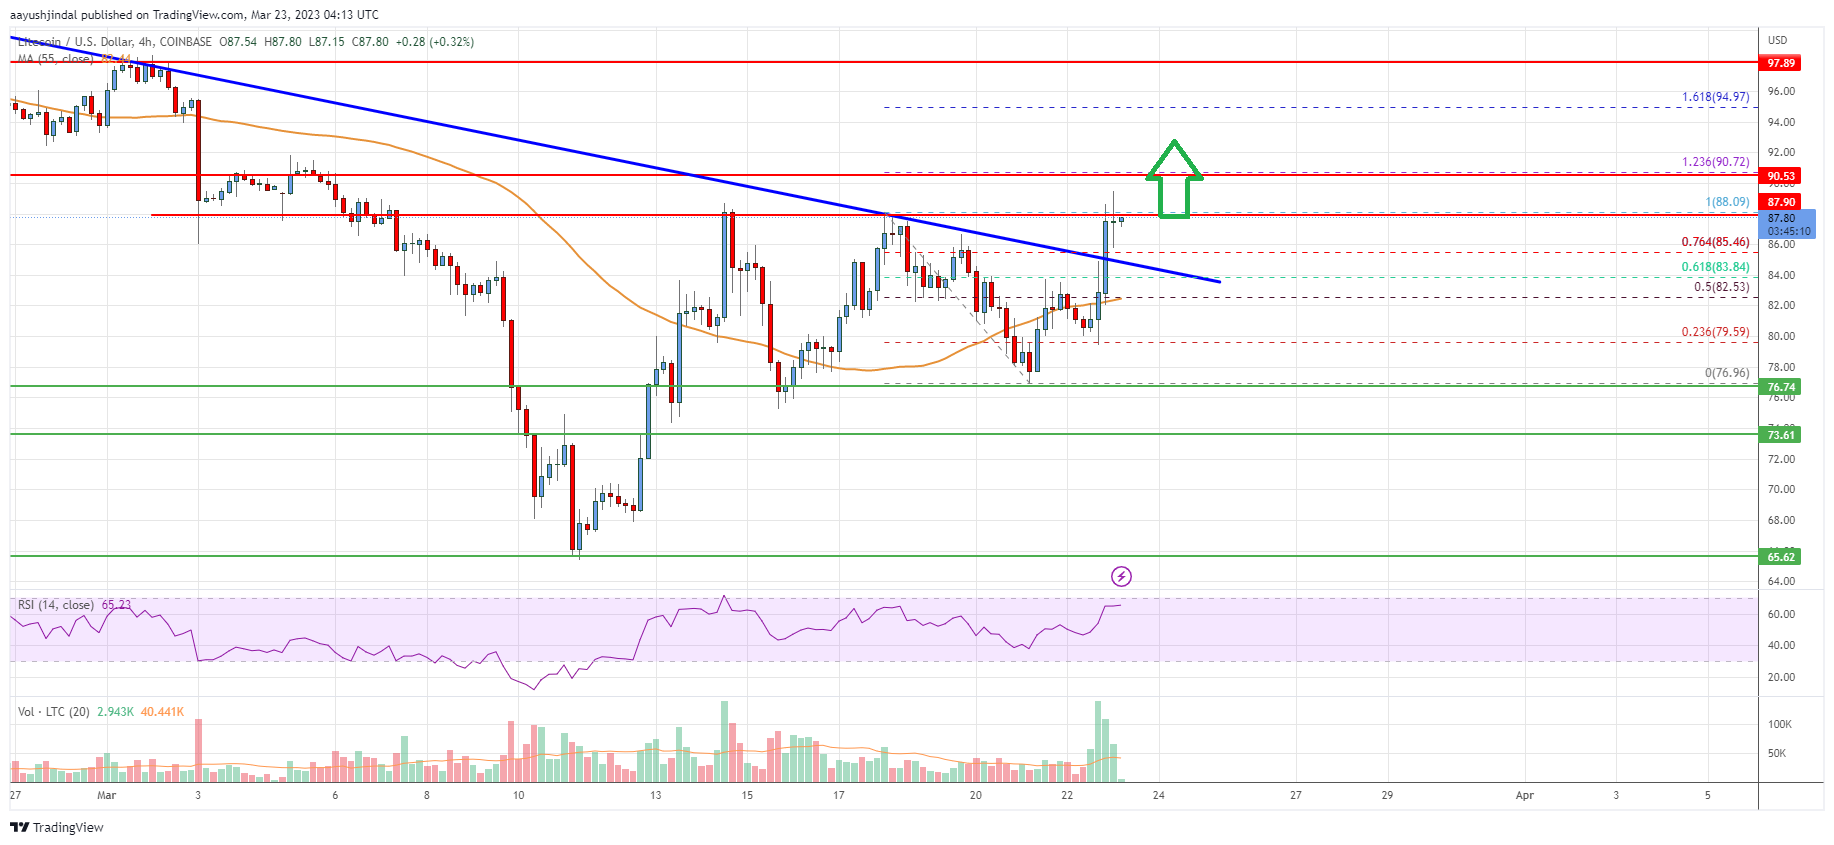
- There was a break above a major bearish trend line with resistance at $85 on the 4-hours chart of the LTC/USD pair (data feed from Coinbase).
- The pair could gain bullish momentum if it clears the $88 and $90 resistance levels.
Litecoin price is showing positive signs above $85 against the US Dollar, similar to bitcoin. LTC price could climb further if there is a clear move above $90.
Litecoin Price Analysis
In the past few sessions, there were mostly positive moves in bitcoin, ethereum, ripple, and litecoin against the US Dollar. Earlier, LTC formed a base above the $75 level and started a fresh increase.
There was a clear move above the $78 and $80 resistance levels. During the increase, there was a break above a major bearish trend line with resistance at $85 on the 4-hours chart of the LTC/USD pair. The price even climbed above the $86 level and the 55 simple moving average (4-hours).
There was a clear move above the 76.4% Fib retracement level of the downward move from the $88.06 swing high to $76.96 low. It is now trading above $86 and the 55 simple moving average (4-hours).
On the upside, the price is facing resistance near the $88 level. A clear move above the $88 level could push the price towards the $95 level. It is near the 1.618 Fib extension level of the downward move from the $88.06 swing high to $76.96 low.
The next major resistance sits near the $95 level. Any more gains might send the price towards the $100 level. On the downside, an initial support is near the $85 level.
The next major support is near the $82 level. If there is a downside break below the $82 support, the price could accelerate lower towards the $75 level in the near term.
Looking at the chart, litecoin price is clearly trading above $85 and the 55 simple moving average (4-hours). Overall, the price could gain bullish momentum if it clears the $88 and $90 resistance levels.
Technical indicators
4 hours MACD – The MACD for LTC/USD is now gaining pace in the bullish zone.
4 hours RSI (Relative Strength Index) – The RSI for LTC/USD is now above the 50 level.
Key Support Levels – $85 and $82
Key Resistance Levels – $88 and $90.


Leave a Reply
You must be logged in to post a comment.