- Litecoin price declined recently and traded below the $55.00 support against the US Dollar.
- LTC price is currently consolidating losses near the $55.00 level, with many hurdles on the upside.
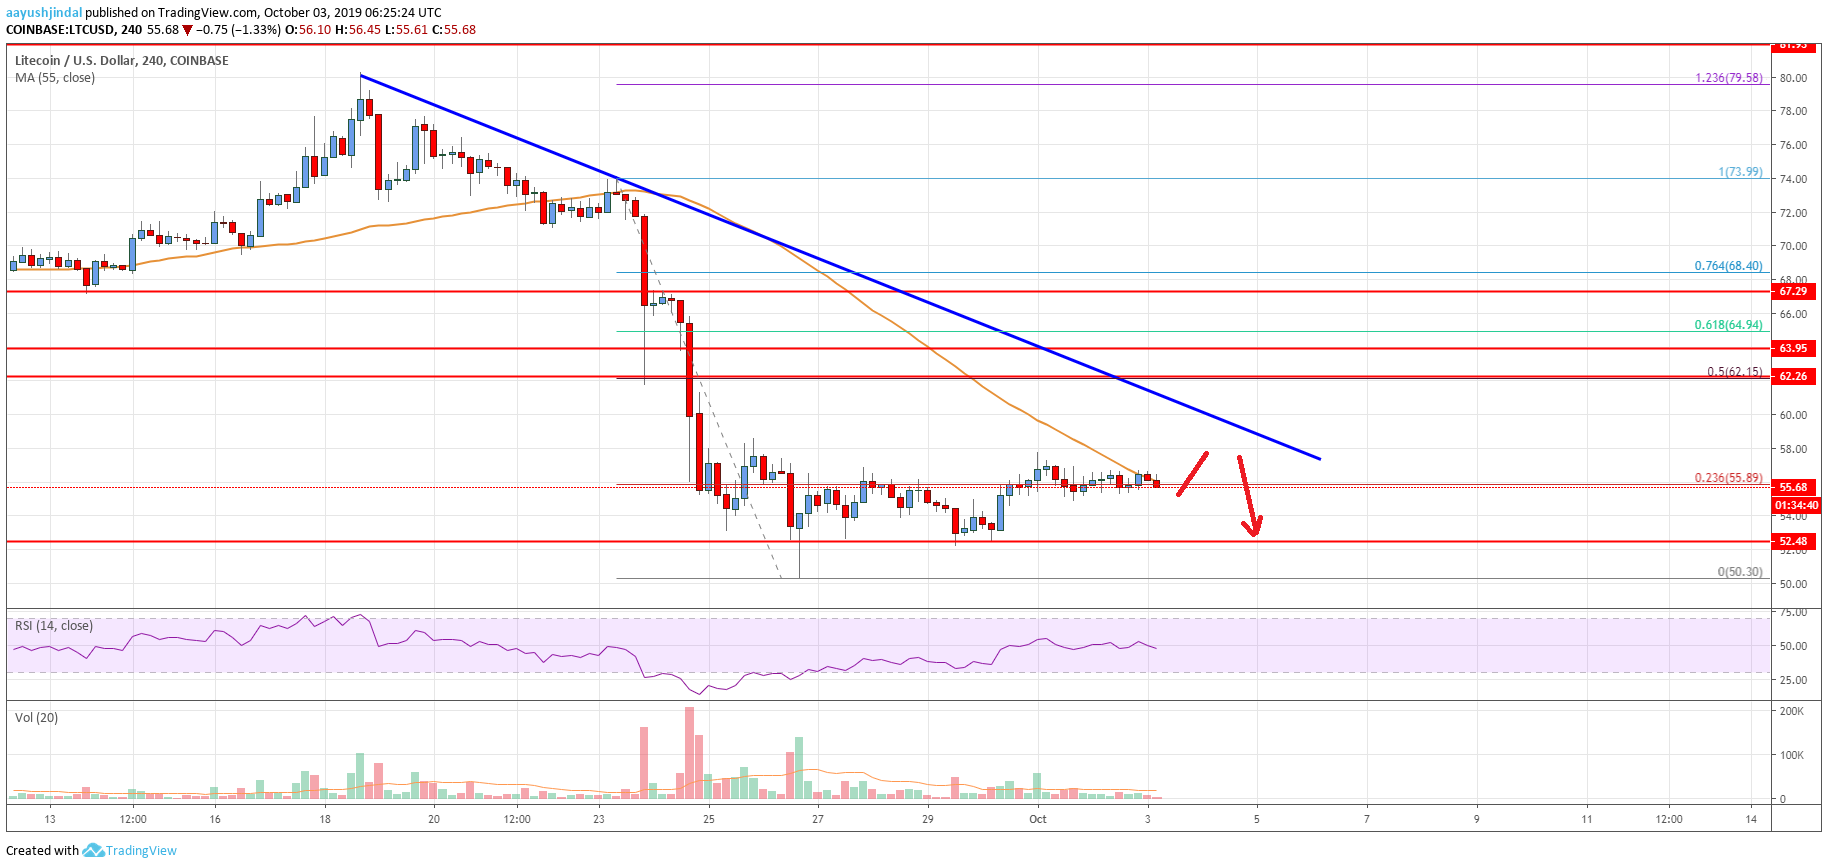
- There is a major bearish trend line forming with resistance near $60.00 on the 4-hours chart of the LTC/USD pair (data feed from Coinbase).
- The pair could recover in the short term, but $60.00 and $62.00 are likely to protect gains.
Litecoin price is currently in a negative zone against the US Dollar and bitcoin. LTC price must break $60.00 and $62.00 to start a strong recovery in the near term.
Litecoin Price Analysis
This past week, there was a downside extension in litecoin price below the $55.00 support against the US Dollar. The LTC/USD pair even broke the $52.50 support and settled well below the 55 simple moving average (4-hours). A swing low was formed near $50.30 and the price is currently consolidating losses. It recovered above the $54.00 and $55.00 levels.
Furthermore, it surpassed the 23.6% Fib retracement level of the last key decline from the $73.99 high to $50.30 low. However, the upward move is facing resistance near the $58.00 level and the 55 simple moving average (4-hours). More importantly, there is a major bearish trend line forming with resistance near $60.00 on the 4-hours chart of the LTC/USD pair.
If there is an upside break above $58.00 and $60.00, the price could test the key $62.50 resistance area. It also coincides with the 50% Fib retracement level of the last key decline from the $73.99 high to $50.30 low. To move into a positive zone, the price must break the $60.00 and $62.50 resistance levels. If the price fails to climb above $60.00 or $62.50, it could resume its decline.
An immediate support is near the $54.00 level. The next key support is near the $52.50 level, below which the price may perhaps test the $50.00 support level. Any further downsides is likely to push the price towards the $46.00 and $45.00 support levels in the near term.
Looking at the chart, litecoin price is currently consolidating losses above the $52.50 support. It seems like the price might correct higher towards $60.00 or $62.50. However, it won’t be easy for the bulls to push the price above the $62.50 resistance area. If they succeed, the price could even surge above the $65.00 resistance and revisit the $70.00 area.
Technical indicators
4 hours MACD – The MACD for LTC/USD is struggling to move into the bullish zone.
4 hours RSI (Relative Strength Index) – The RSI for LTC/USD is currently close to the 50 level.
Key Support Levels – $52.50 and $50.00.
Key Resistance Levels – $60.00 and $62.50.
