- Litecoin price failed to continue above the $150 resistance zone against the US Dollar.
- LTC price is now trading below $140 and the 55 simple moving average (4-hours).
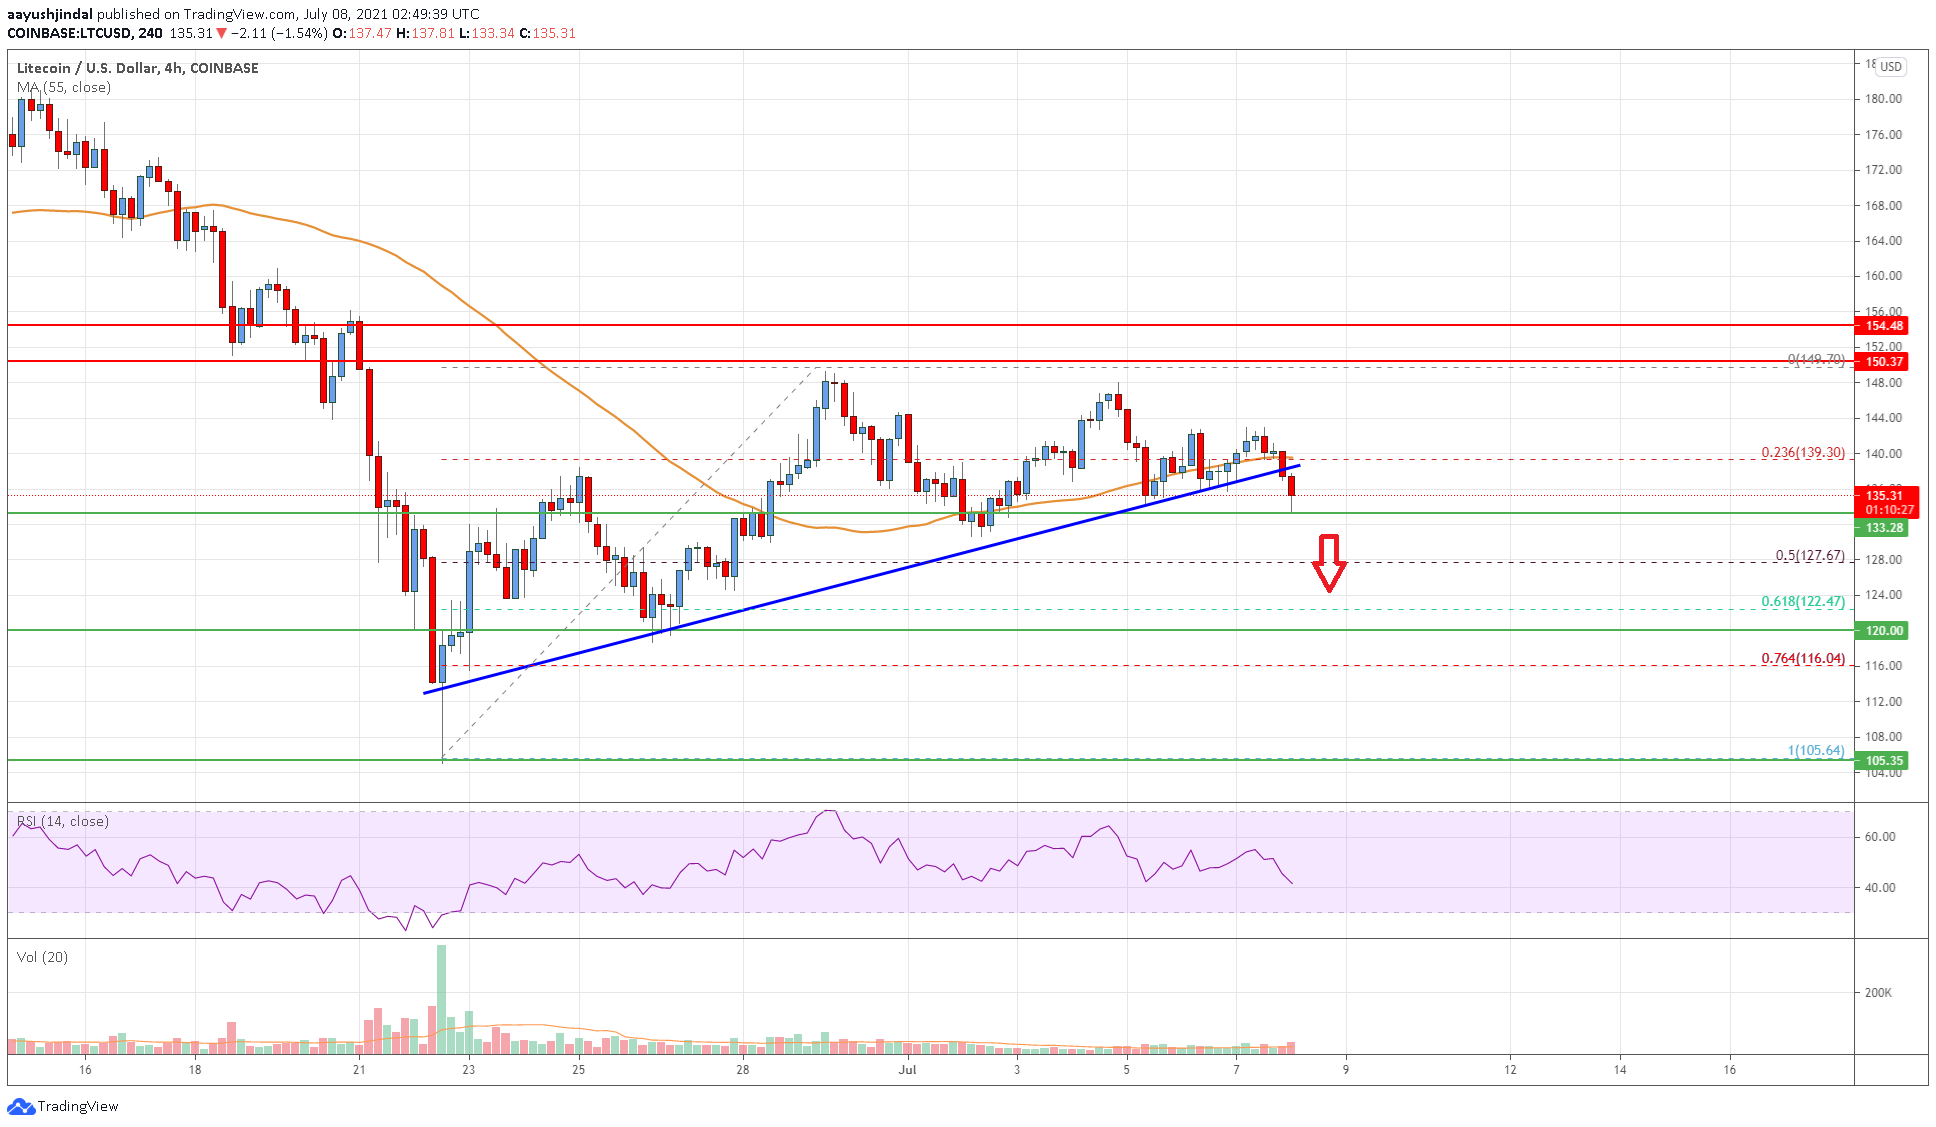
- There was a break below a key bullish trend line with support near $136 on the 4-hours chart of the LTC/USD pair (data feed from Coinbase).
- The pair could continue to move down if it breaks the $132 and $130 support levels in the near term.
Litecoin price is slowly gaining pace below $140 against the US Dollar, unlike bitcoin. LTC price must stay above $130 to avoid more losses.
Litecoin Price Analysis
This week, there was a decent upward move in bitcoin, ethereum, ripple, and litecoin against the US Dollar. Earlier, LTC formed a base above the $130 level and it started a fresh increase.
The bulls were able to push the price above the $140 level and the 55 simple moving average (4-hours). However, the price failed to continue higher above the $150 resistance zone. A high was formed near $150 before the price started a fresh decline.
The price traded below the $142 support level. It broke the 23.6% Fib retracement level of the upward move from the $105 swing low to $150 swing high. There was also a break below a key bullish trend line with support near $136 on the 4-hours chart of the LTC/USD pair.
The pair is now trading below $140 and the 55 simple moving average (4-hours). An immediate support is near the $132 level. The first major support is near the $128 level.
The 50% Fib retracement level of the upward move from the $105 swing low to $150 swing high is also near the $128 level. Any more losses might call for a drop towards the $120 level. On the upside, an initial resistance is near the $140 level and the 55 SMA.
The next key resistance is near the $148 level and $150. A close above the $150 level is needed for a strong increase in the near term.
Looking at the chart, litecoin price is clearly trading below $140 and the 55 simple moving average (4-hours). Overall, the price could continue to move down if it breaks the $132 and $130 support levels in the near term.
Technical indicators
4 hours MACD – The MACD for LTC/USD is slowly gaining pace in the bearish zone.
4 hours RSI (Relative Strength Index) – The RSI for LTC/USD is now below the 50 level.
Key Support Levels – $132 and $128.
Key Resistance Levels – $140 and $150.


Leave a Reply
You must be logged in to post a comment.