- Ripple price started an upside correction above the $0.6500 resistance against the US dollar.
- The price is now trading nicely above $0.6500 and the 55 simple moving average (4-hours).
- There is a key bullish trend line forming with support near $0.6700 on the 4-hours chart of the XRP/USD pair (data source from Bittrex).
- The pair could start a major increase if it stays above the main $0.6500 support zone.
Ripple price is slowly recovering above $0.6500 against the US Dollar. XRP price could continue to rise towards $0.7500 if the bulls remain in action above $0.6500.
Ripple Price Analysis
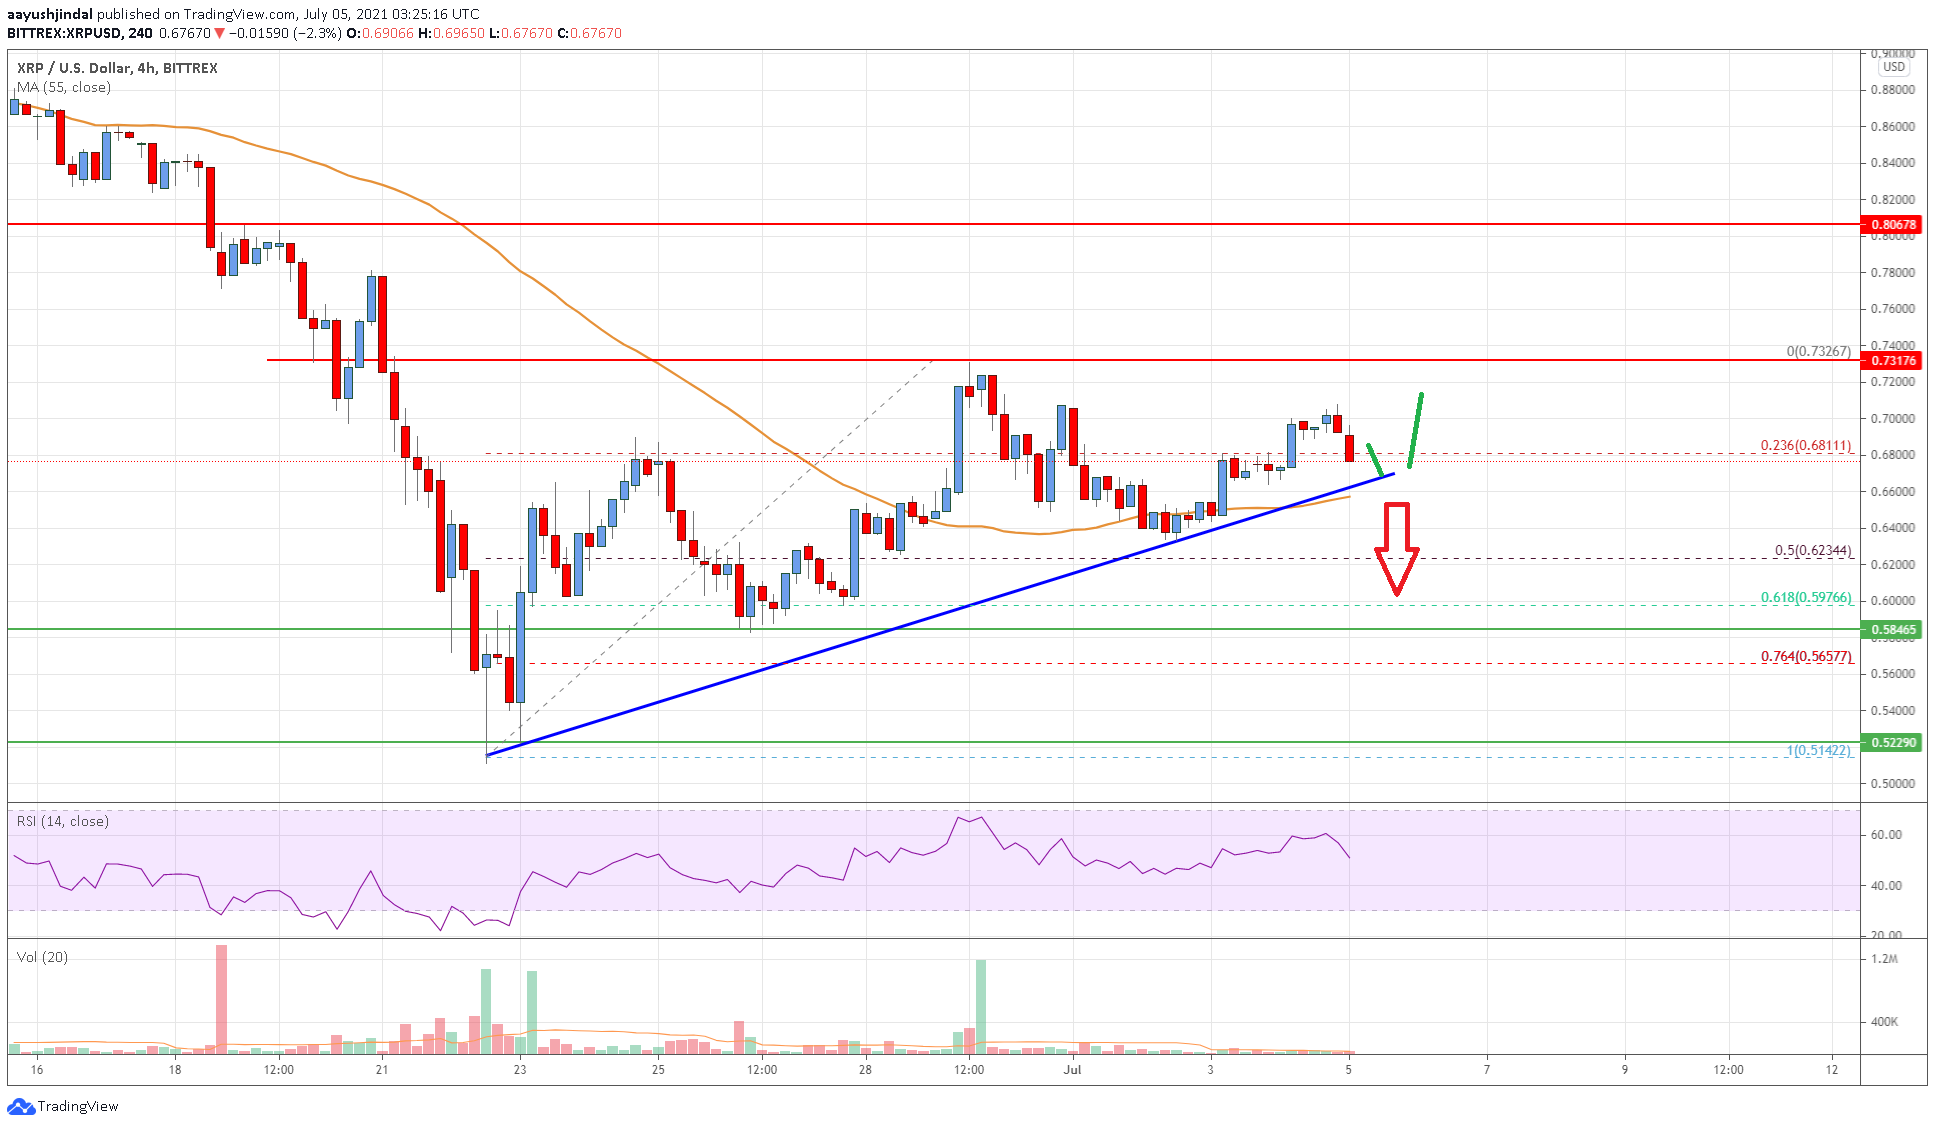
After forming a base above the $0.6000 zone, ripple price started a fresh increase against the US Dollar. The XRP/USD pair broke the $0.6200 pivot level to move into a positive zone.
There was a break above the $0.6500 barrier and the 55 simple moving average (4-hours). The pair traded above the $0.7000 resistance. A high was formed near $0.7326 before the pair started a downside correction. There was a break below the $0.7000 support zone.
The price declined below the 23.6% Fib retracement level of the upward move from the $0.5142 swing low to $0.7326 high. However, the price is trading nicely above $0.6500 and the 55 simple moving average (4-hours).
There is also a key bullish trend line forming with support near $0.6700 on the 4-hours chart of the XRP/USD pair. If there is a downside break, the price could test the $0.6200 support. If it close to the 50% Fib retracement level of the upward move from the $0.5142 swing low to $0.7326 high.
Any more losses might call for a test of the $0.6000 level. On the upside, the first key resistance is near the $0.7000 level. The next key resistance is near the $0.7350 level.
A break above $0.7000 and $0.7350 could open the doors for a move towards $0.8000. The next major resistance could be near $0.8800.

Looking at the chart, ripple price is clearly trading above $0.6500 and the 55 simple moving average (4-hours). Overall, the price could start a major increase if it stays above the main $0.6500 support zone.
Technical indicators
4 hours MACD – The MACD for XRP/USD is now losing momentum in the bullish zone.
4 hours RSI (Relative Strength Index) – The RSI for XRP/USD is now close to the 50 level.
Key Support Levels – $0.65, $0.62 and $0.60.
Key Resistance Levels – $0.70 and $0.735.


Leave a Reply
You must be logged in to post a comment.