- Ripple price is attempting a recovery above $0.6400 against the US dollar.
- The price is facing resistance near $0.6500 and the 55 simple moving average (4-hours).
- There is a key bearish trend line forming with resistance near $0.6500 on the 4-hours chart of the XRP/USD pair (data source from Bittrex).
- The pair could start a major increase if there is a clear break above the $0.6500 resistance zone.
Ripple price is slowly recovering above $0.6200 against the US Dollar. XRP price could continue to rise $0.6500 if the bulls remain in action above $0.6000.
Ripple Price Analysis
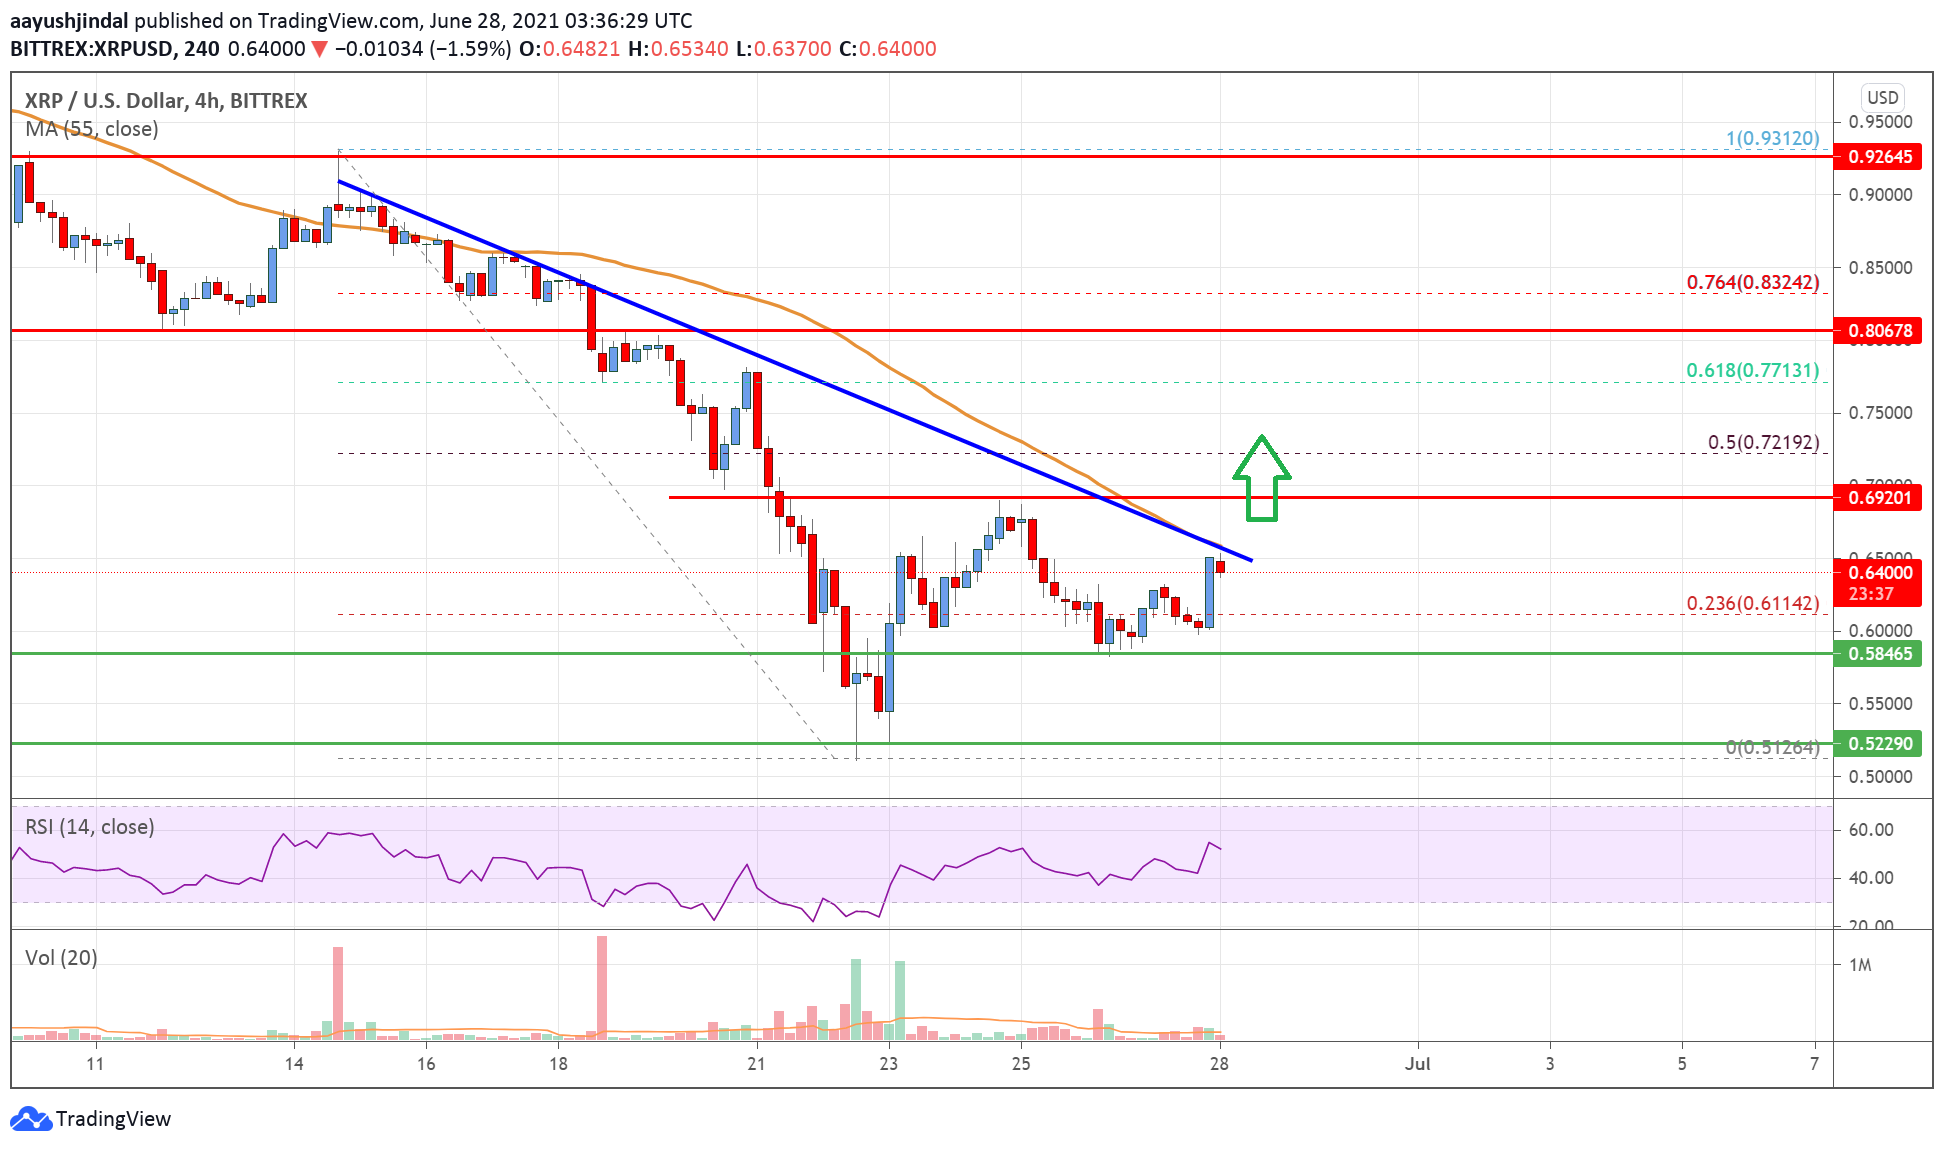
There was a downside extension below the $0.6000 level in ripple price against the US Dollar. The XRP/USD pair declined heavily below $0.5500 and the 55 simple moving average (4-hours).
It traded close to the $0.5000 level. A low was formed near $0.5125 and the price recently started a steady recovery wave. There was a break above the $0.6000 resistance zone. The price climbed above the 23.6% Fib retracement level of the downward move from the $0.9310 swing high to $0.5125 low.
It is now facing resistance near $0.6500 and the 55 simple moving average (4-hours). There is also a key bearish trend line forming with resistance near $0.6500 on the 4-hours chart of the XRP/USD pair.
If there is a clear upside break above the trend line, the price could test the $0.7000 level. The next major resistance is near the $0.7200 level. It is near the 50% Fib retracement level of the downward move from the $0.9310 swing high to $0.5125 low.
A break above $0.7000 and $0.7200 could open the doors for a move towards $0.8000. If there is no upside break, the price could continue to move down below $0.620. The next support is near $0.760, below which the bears are likely to aim a test of $0.500.

Looking at the chart, ripple price is clearly facing hurdles near $0.6500 and the 55 simple moving average (4-hours). Overall, the price could start a major increase if there is a clear break above the $0.6500 resistance zone.
Technical indicators
4 hours MACD – The MACD for XRP/USD is now gaining momentum in the bullish zone.
4 hours RSI (Relative Strength Index) – The RSI for XRP/USD is now above the 50 level.
Key Support Levels – $0.62, $0.60 and $0.55.
Key Resistance Levels – $0.65 and $0.72.


Leave a Reply
You must be logged in to post a comment.