- Litecoin price remained well supported above $86.00 and recently recovered against the US Dollar.
- LTC price is currently trading with a positive bias above $90.00 and $92.00 levels.
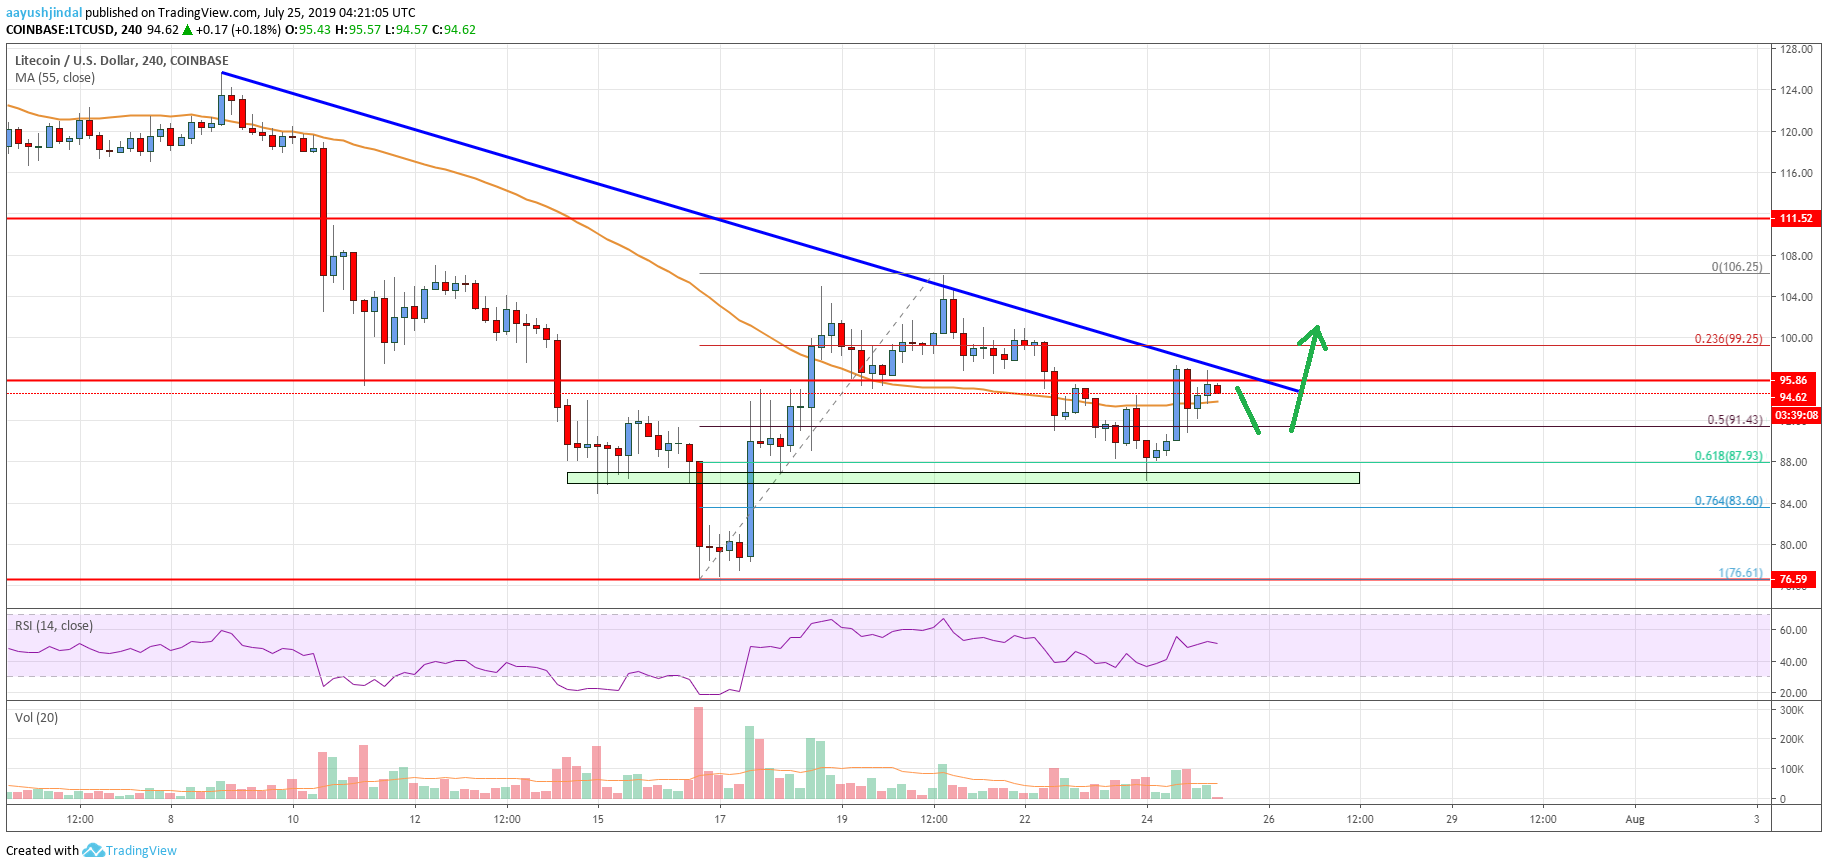
- There is a major bearish trend line forming with resistance near $96.80 on the 4-hours chart of the LTC/USD pair (data feed from Coinbase).
- The pair could start a strong upward move if there is an upside break above $97.00 and $98.00.
Litecoin price is slowly gaining traction above $95.00 against the US Dollar, similar to bitcoin. However, LTC price must break the $98.00 resistance to continue higher in the near term.
Litecoin Price Analysis
After trading close to the $106.00 resistance, litecoin price started a downside correction against the US Dollar. The LTC/USD pair traded below the $100.00 and $95.00 support levels. Moreover, there was a break below the $92.00 support and the 55 simple moving average (4-hours). It opened the doors for more losses below the 50% Fib retracement level of the upward move from the $76.61 low to $106.25 high.
The price even spiked below the $88.00 support level. However, the $86.50 level acted as a strong support. Moreover, the 61.8% Fib retracement level of the upward move from the $76.61 low to $106.25 high acted as a decent support. The price formed a decent support near $88.00 and recently started a fresh increase. It broke the key $90.00 and $92.00 resistance levels to move into a positive zone.
Besides, there was a close above $92.00 and the 55 simple moving average (4-hours). However, the price is now facing a major resistance near the $97.00 and $98.00 levels. Moreover, there is a key bearish trend line forming with resistance near $96.80 on the 4-hours chart of the LTC/USD pair. If there is an upside break above the trend line, the price could continue to rise.
The next important resistance is near the $106.00 swing high. If there are more gains, the price may even surge above the $110.00 level. On the other hand, if there is no upside break, the price could correct lower below $92.00. The main support is near the $86.50 level, below which the price could slide back towards $80.00.

Looking at the chart, litecoin price is clearly trading near a major resistance at $98.00. A successful upside break might start a strong rise above the $100.00 and $105.00 resistance levels in the near term.
Technical indicators
4 hours MACD – The MACD for LTC/USD is currently showing positive signs in the bullish zone.
4 hours RSI (Relative Strength Index) – The RSI for LTC/USD is struggling to hold the 50 level.
Key Support Levels – $86.50 and $80.00.
Key Resistance Levels – $98.00 and $106.00.


Leave a Reply
You must be logged in to post a comment.