- Litecoin price declined heavily in the past few days below $100.00 and $90.00 against the US Dollar.
- LTC price even broke the $80.00 support level and traded close to the $76.50 level.
- There are two key bearish trend lines forming with resistance near $94.00 and $111.50 on the 4-hours chart of the LTC/USD pair (data feed from Coinbase).
- The pair could struggle to climb above the $94.00-95.00 resistance area in the near term.
Litecoin price is currently recovering from $76.60 against the US Dollar, just like bitcoin from $9,200. However, LTC price might struggle near the $95.00 or $100.00 resistance level.
Litecoin Price Analysis
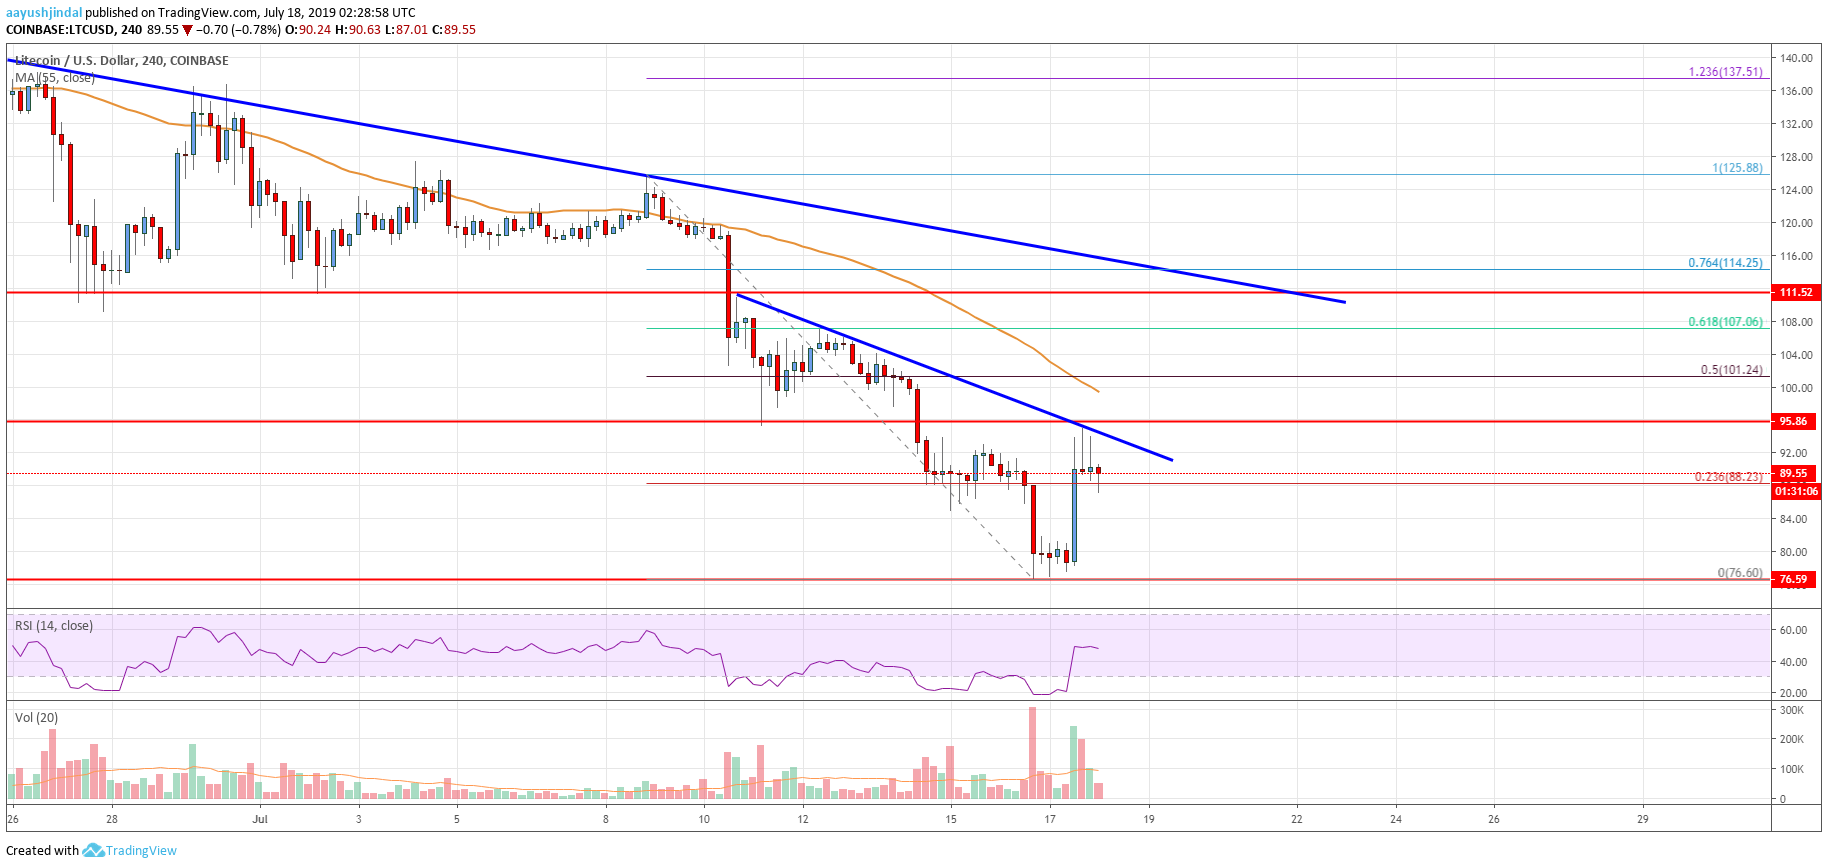
In the past few days, litecoin price declined heavily after it failed to clear the $125.00 resistance against the US Dollar. The LTC/USD pair broke many supports, including $110.00 and $100.00. Moreover, there was a close below the $100.00 support and the 55 simple moving average (4-hours). It opened the doors for more losses and the price traded below the $95.00 and $90.00 support levels.
Finally, the price even broke the $80.00 support and traded to a new monthly low at $76.60. Recently, the price started an upside correction above $80.00 and jumped more than 10%. It broke the 23.6% Fib retracement level of the recent slide from the $125.88 high to $76.60 low. However, the upward move was capped by the $95.00 resistance area.
Moreover, there are two key bearish trend lines forming with resistance near $94.00 and $111.50 on the 4-hours chart of the LTC/USD pair. Above the first trend line and $95.00, the price might face resistance near $100.00. The 50% Fib retracement level of the recent slide from the $125.88 high to $76.60 low is near the $100.00 resistance. Besides, the 55 simple moving average (4-hours) is also positioned near the $100.00 level.
Therefore, the price is likely to face a lot of hurdles near the $95.00 and $100.00 resistance levels. If there is a successful close above $100.00 and the 55 simple moving average (4-hours), there are chances of a strong recovery in the near term. If not, the price might resume its slide below the $88.00 and $85.00 support levels.

Looking at the chart, litecoin price is clearly facing a strong resistance near the $95.00 and $100.00 levels. If it continues to struggle below $100.00, the bears are likely to push the price back below the $85.00 support in the near term.
Technical indicators
4 hours MACD – The MACD for LTC/USD is currently placed in the bullish zone.
4 hours RSI (Relative Strength Index) – The RSI for LTC/USD is still below the 50 level despite the recent jump.
Key Support Levels – $85.00 and $80.00.
Key Resistance Levels – $95.00 and $100.00.


Leave a Reply
You must be logged in to post a comment.