- Litecoin price failed to climb above $125.00 and declined heavily against the US Dollar.
- LTC price is down more than 15% and it recently broke the $110.00 and $105.00 support levels.
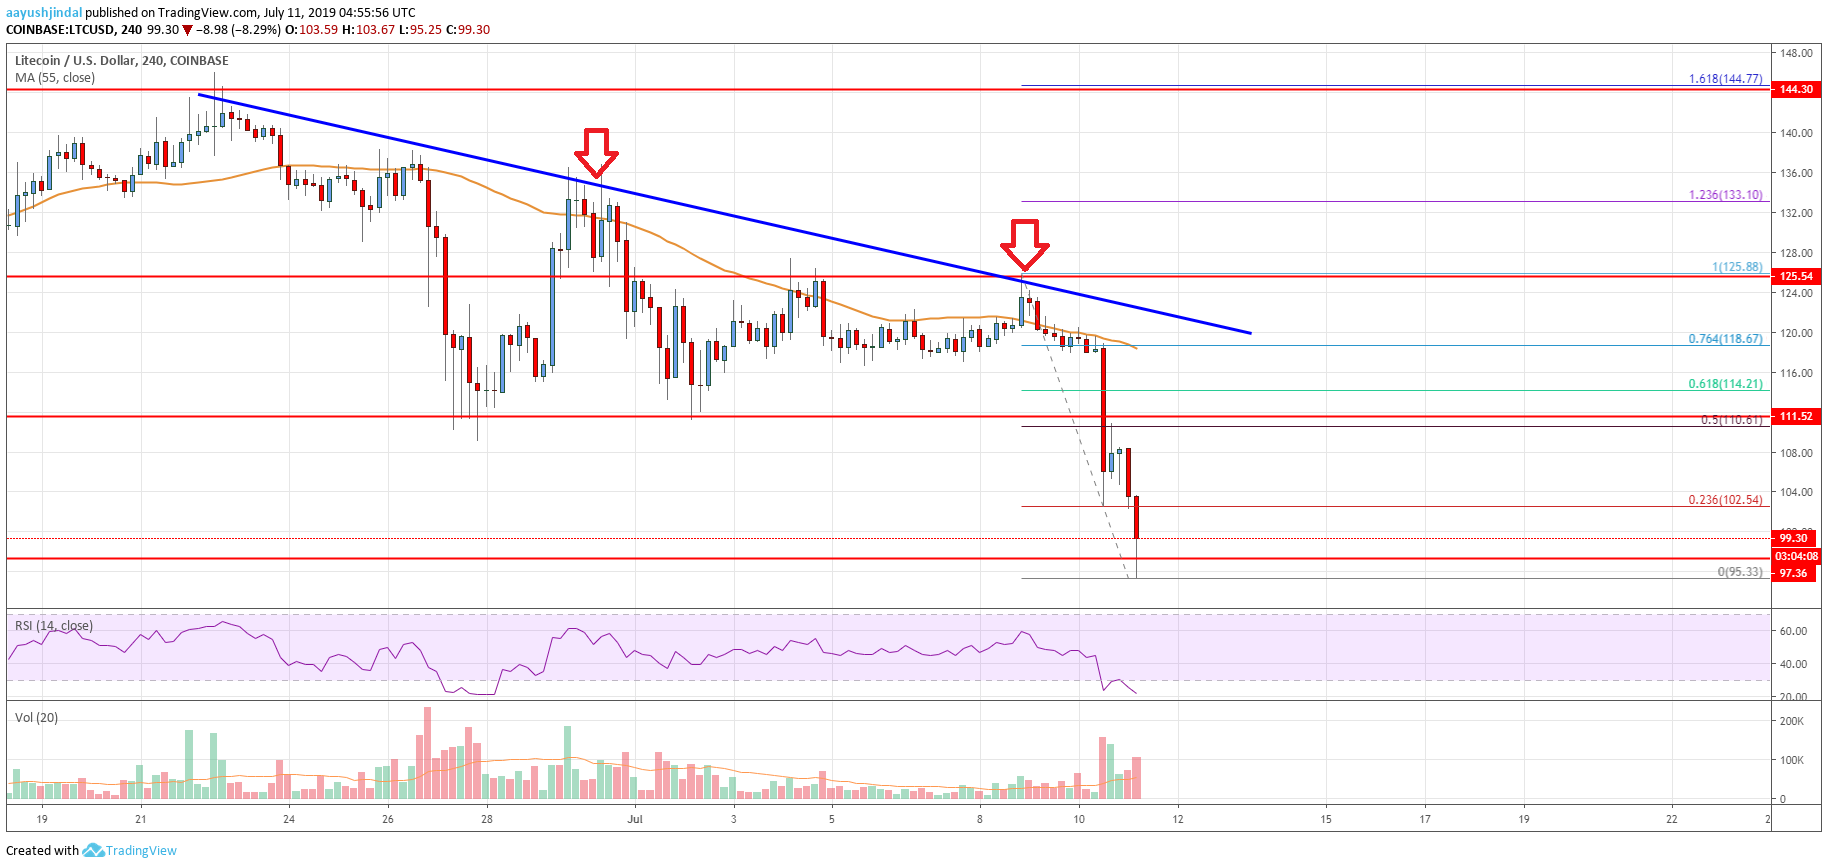
- There is a major bearish trend line forming with resistance near $118.80 on the 4-hours chart of the LTC/USD pair (data feed from Coinbase).
- The pair must stay above the $100.00 support to start a decent recovery in the near term.
Litecoin price declined heavily from the $125.00 resistance area against the US Dollar, similar to bitcoin. LTC price is currently under pressure and testing the key $100.00 support area.
Litecoin Price Analysis
In the past few days, litecoin price made a few attempts to break the $125.00 resistance against the US Dollar. The LTC/USD pair failed to gain momentum above $125.00 and started a sharp decline. It broke a few important supports near $120.00 and $115.00 to enter a bearish zone. Moreover, there was a close below the $110.00 support and the 55 simple moving average (4-hours).
The recent decline was such that the price even broke the $100.00 support area. A new monthly low was formed at $95.33 and the price is currently trading with a bearish zone. An initial resistance is near the $102.50 level plus the 23.6% Fib retracement level of the last drop from the $125.88 high to $95.33 low. On the upside, there are many important resistances near the $110.00 and $111.50 levels.
Moreover, the 50% Fib retracement level of the last drop from the $125.88 high to $95.33 low is near the $110.81 level to act as a resistance. There is also a major bearish trend line forming with resistance near $118.80 on the 4-hours chart of the LTC/USD pair. The 55 simple moving average (4-hours) is also near the $118.00 resistance. Therefore, an upside correction could find resistance near $110.00 or $118.00.
On the downside, the main supports are near $100.00 and $95.00. If there is a daily close below $100.00, the price could move into a strong bearish zone. In the mentioned case, it could even decline towards the $92.00 or $84.00 support level in the near term.

Looking at the chart, litecoin price is clearly trading in a bearish zone below the $110.00 level. As long as it is below the $110.00 pivot level, there is a risk of more losses towards the $92.00 or $84.00 support.
Technical indicators
4 hours MACD – The MACD for LTC/USD is currently gaining momentum in the bearish zone.
4 hours RSI (Relative Strength Index) – The RSI for LTC/USD is currently well below the 30 level, with a bearish angle.
Key Support Levels – $100.00 and $95.00.
Key Resistance Levels – $105.00 and $110.00.


Leave a Reply
You must be logged in to post a comment.