- EOS price failed to hold the key $5.420 support area and declined heavily against the US Dollar.
- The price is down more than 20% and it even broke the $4.800 support area.
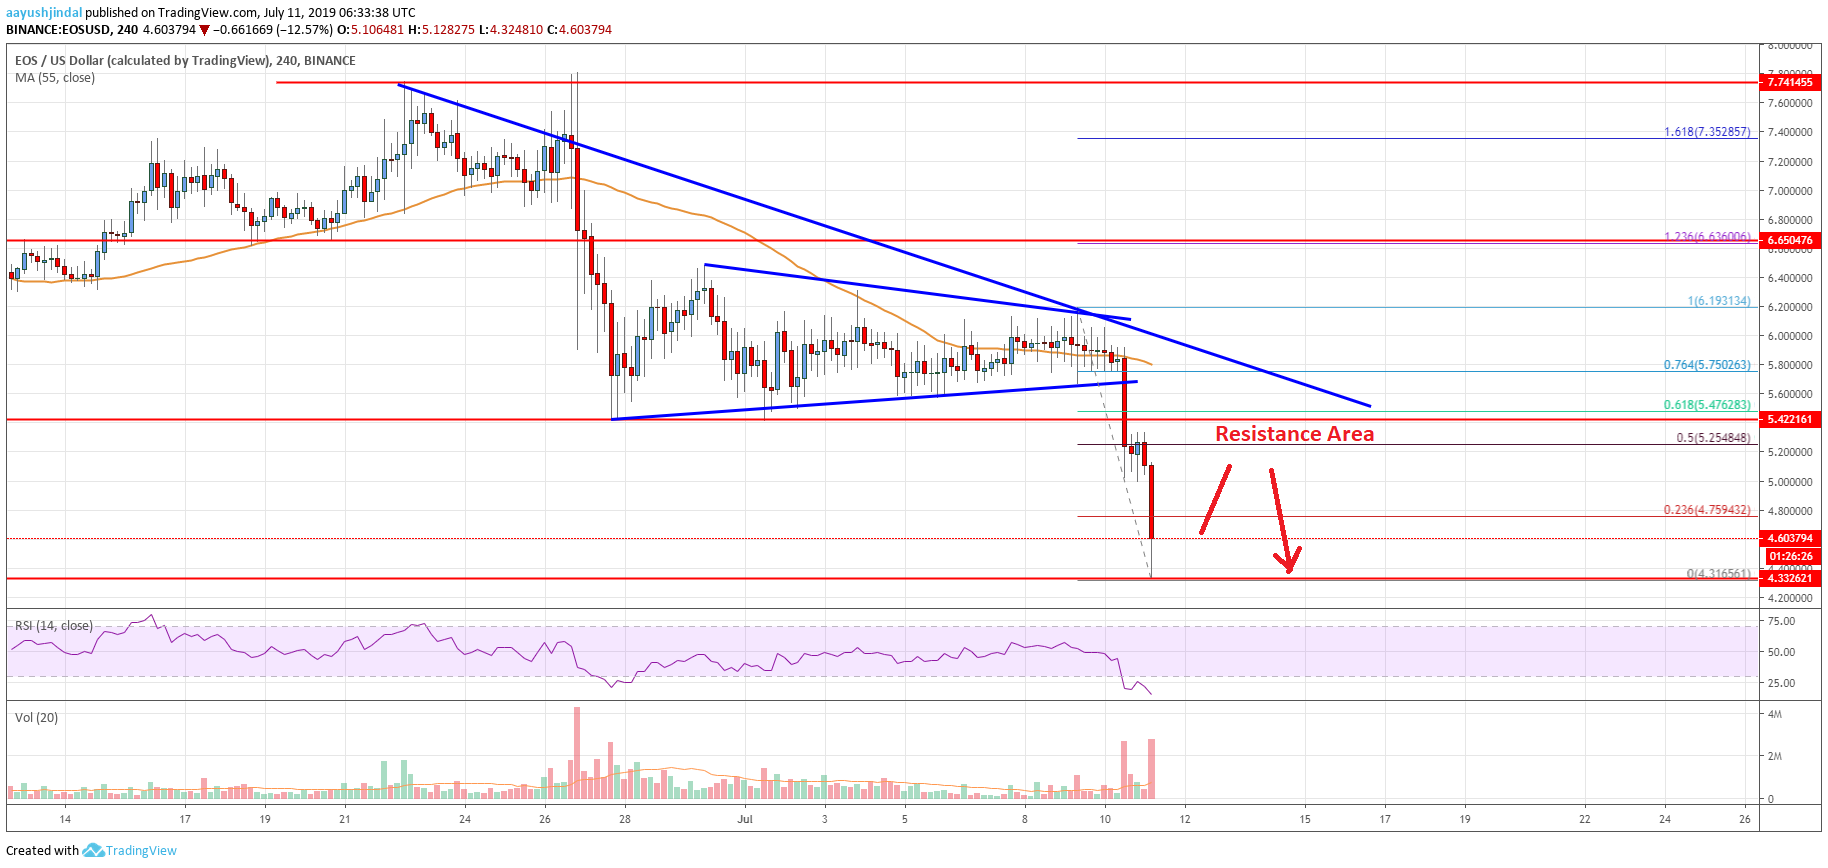
- There is a major bearish trend line forming with resistance near $5.620 on the 4-hours chart of the EOS/USD pair (data feed from Binance).
- The pair could correct higher, but the $5.000 and $5.200 levels are likely to act as hurdles.
EOS price is currently under a lot of pressure against the US Dollar and bitcoin. The price may continue to decline and it could even test the $4.000 support in the near term.
EOS Price Analysis
This week, there a strong rise in bitcoin, but Ethereum, ripple, litecoin and EOS struggled against the US Dollar. EOS price mostly traded in a range below the $6.400 and $6.200 resistance levels. Recently, there was a sharp decline in BTC/USD below the $12,000 level, igniting sharp losses in altcoins. EOS declined more than 20% and broke many supports, including $5.800, $5.500 and $5.000.
Moreover, there was a break below a crucial contracting triangle with support near $5.700 on the 4-hours chart of the EOS/USD pair. The pair tumbled below the $5.000 support and the 55 simple moving average (4-hours). It even broke the $4.500 support and traded as low as $4.316 recently. At the outset, the price is retreating from the low and it could test the $4.700 resistance.
The 23.6% Fib retracement level of the downward move from the $6.193 high to $4.316 low is also near the $4.750 level to act as a resistance. On the upside, there are many hurdles for the bulls near the $5.000 and $5.200 levels. Moreover, there is a major bearish trend line forming with resistance near $5.620 on the same chart. The 50% Fib retracement level of the downward move from the $6.193 high to $4.316 low is also near the $5.254 to act as a strong barrier for the bulls.
On the downside, an initial support is near the $4.400 level, below which there is a risk of more losses below the $4.316 low. The next support is near the $4.200 level, followed by the key $4.000 support.

Looking at the chart, EOS price is clearly under a lot of pressure below the $5.000 pivot level. If it fails to stay above the $4.400 level, there could be heavy losses in the near term.
Technical indicators
Hourly MACD – The MACD for EOS/USD is currently gaining momentum in the bearish zone.
Hourly RSI (Relative Strength Index) – The RSI is currently well below the 25 level, with a bearish angle.
Major Support Levels – $4.400 and $4.200.
Major Resistance Levels – $5.000 and $5.200.


Leave a Reply
You must be logged in to post a comment.