- Ripple price traded to a new monthly low at $0.3750 before correcting higher against the US dollar.
- The price is facing a couple of important hurdles near $0.4000 and $0.4100.
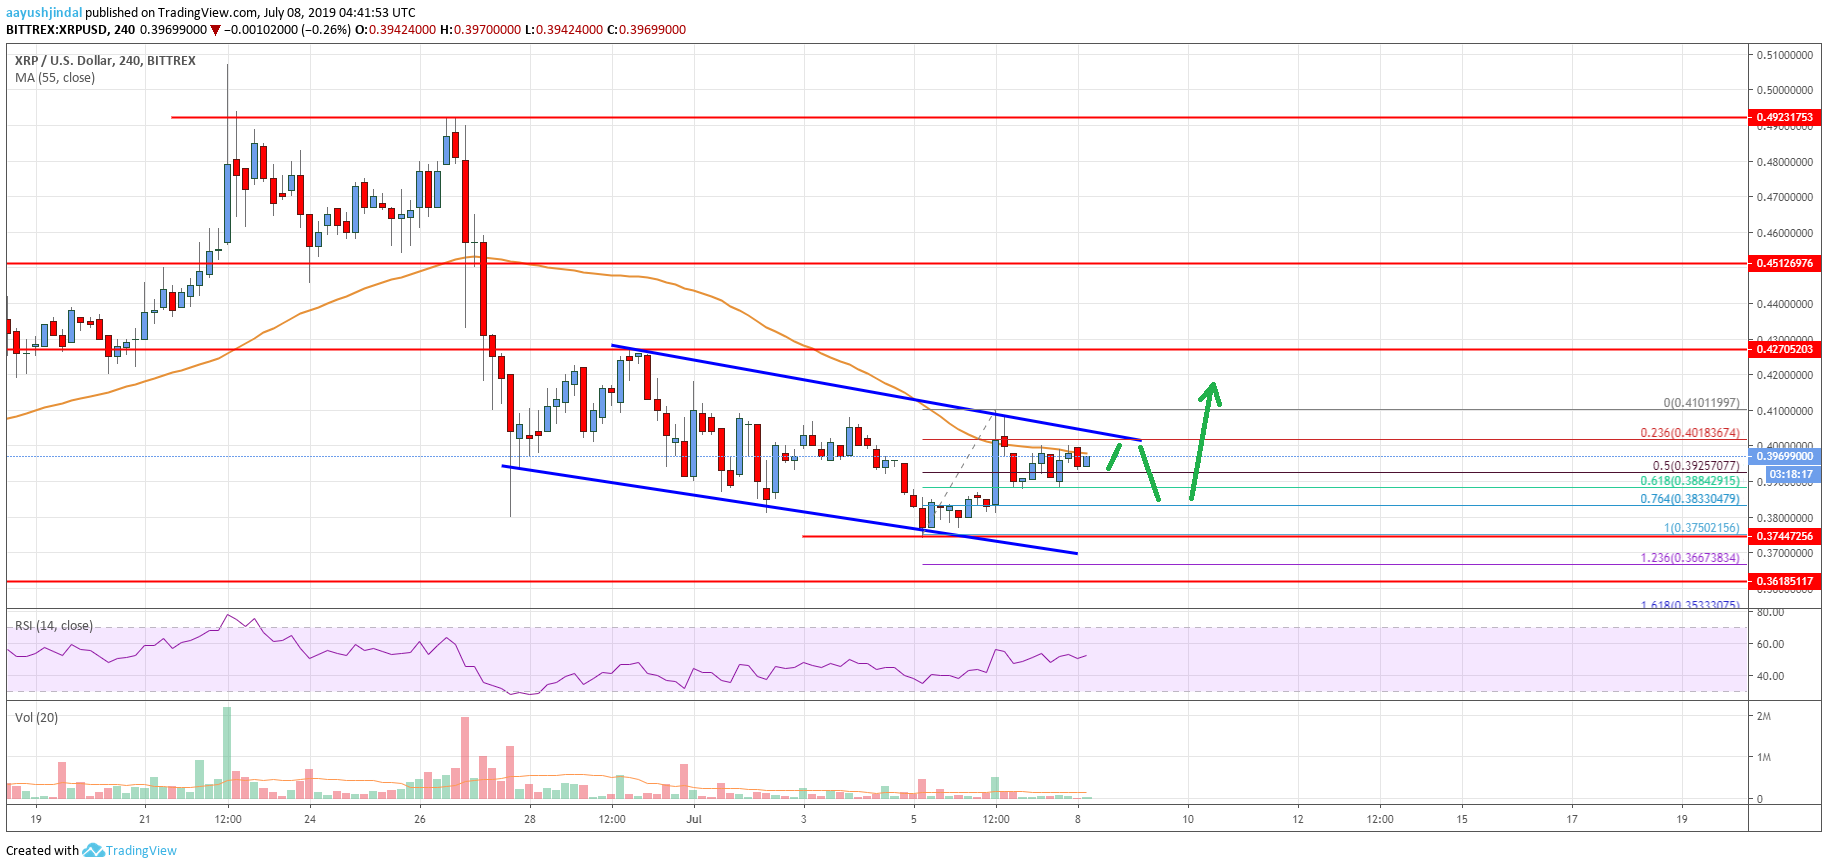
- There is a declining channel in place with resistance near $0.4020 on the 4-hours chart of the XRP/USD pair (data source from Bittrex).
- The price is likely to start a strong upward move once it clears $0.4100 and $0.4275 in the near term.
Ripple price is facing a lot of key resistances below $0.4100 against the US Dollar. XRP remains supported on dips and it could rise sharply above $0.4100 and $0.4150.
Ripple Price Analysis
This past week, there were a few bearish moves in bitcoin, Ethereum, bitcoin cash, ADA and ripple against the US Dollar. The XRP/USD pair struggled to stay above the $0.3910 and $0.3840 support levels. As a result, there was a downside extension below $0.3800 and the price settled below the 55 simple moving average (4-hours). It traded to a new monthly low at $0.3750 before correcting higher.
It recovered above the $0.3850 and $0.3910 resistance levels. Moreover, there was a push above the $0.4000 resistance. However, the price failed near the $0.4100 resistance and struggled to settle above the 55 simple moving average (4-hours). A swing high was formed near $0.4101 and the price is currently consolidating in a range. It traded below the 50% Fib retracement level of the last wave from the $0.3750 low to $0.4101 high.
However, the $0.3880 level is acting as a support. Moreover, the 61.8% Fib retracement level of the last wave from the $0.3750 low to $0.4101 high is holding downsides. At the moment, there is a declining channel in place with resistance near $0.4020 on the 4-hours chart of the XRP/USD pair. If the pair surpasses the channel resistance and $0.4050, it could gain bullish momentum.
On the upside, the main resistance is near the $0.4100 level, above which the price is likely to test the $0.4272 resistance area. On the other hand, if there is a downside break, the price could revisit the $0.3750 support area. Any further downsides may perhaps increase bearish pressure and the price might slide towards the $0.3500 level.

Looking at the chart, ripple price is currently consolidating in a range and it seems to be preparing for an upside break above $0.4050 and $0.4100. Once the bulls gain pace above $0.4100, there could be a strong upward move.
Technical indicators
4 hours MACD – The MACD for XRP/USD is slowly gaining momentum in the bullish zone.
4 hours RSI (Relative Strength Index) – The RSI for XRP/USD is currently just above the 50 level, with positive signs.
Key Support Levels – $0.3880, $0.3750 and $0.3500.
Key Resistance Levels – $0.4100 and $0.4275.


Leave a Reply
You must be logged in to post a comment.