- Litecoin price declined sharply before it found support just above $110.00 against the US Dollar.
- LTC price is currently trading near $120.00 and it is facing a lot of hurdles near $125.00 and $128.00.
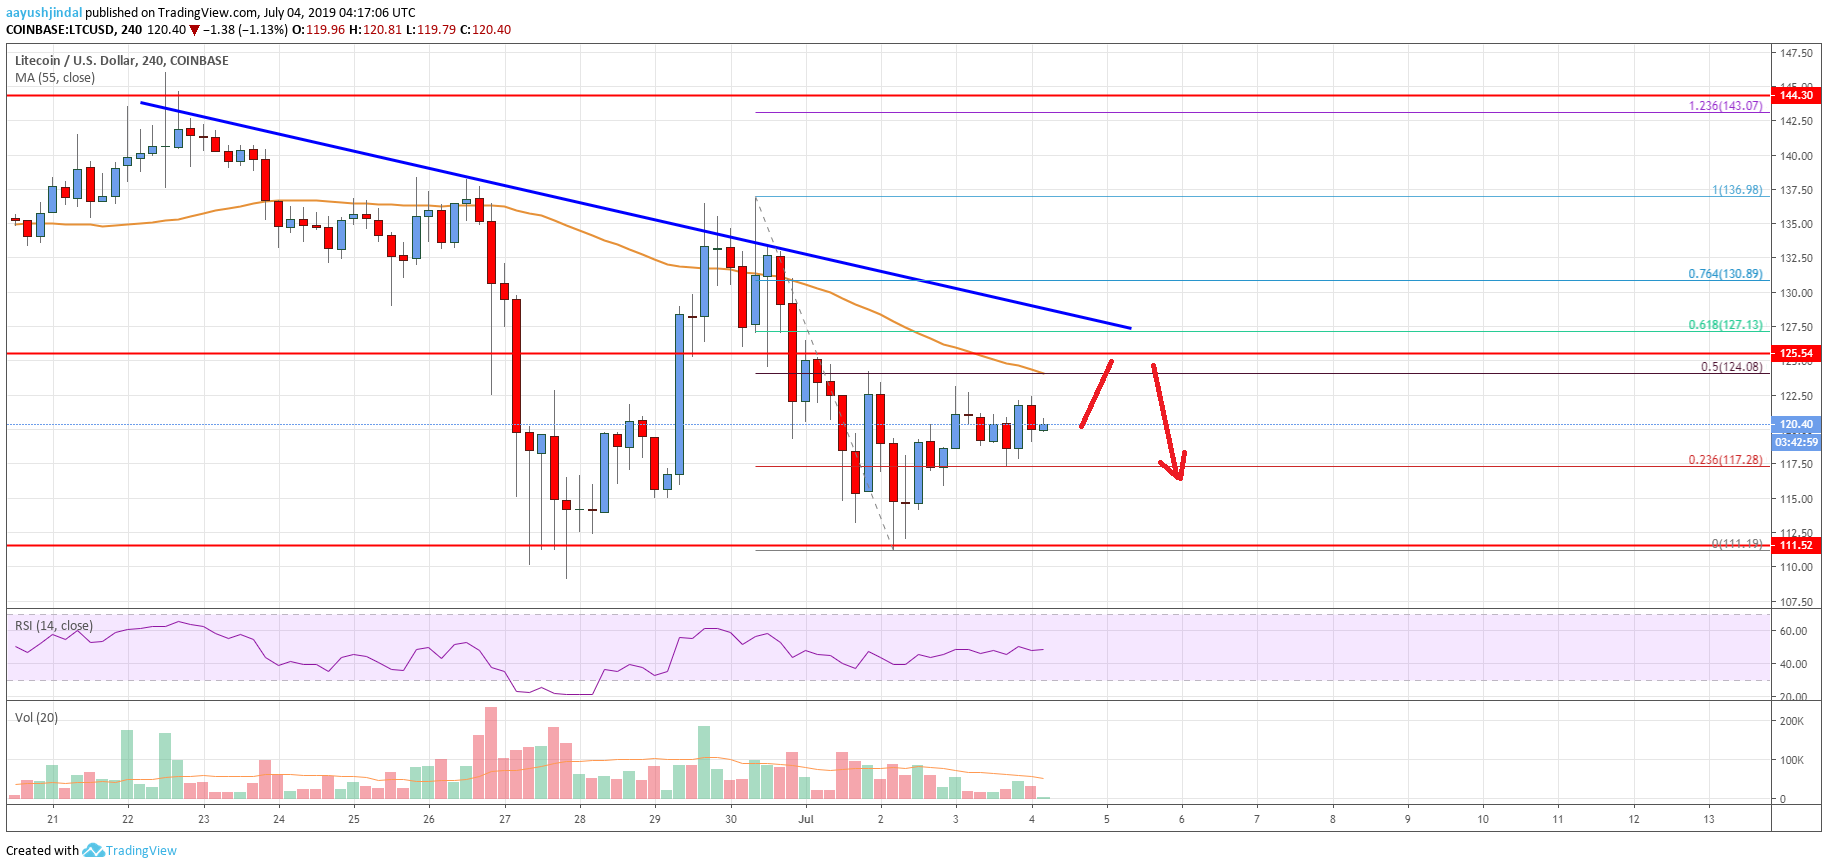
- There is a crucial bearish trend line forming with resistance near $127.50 on the 4-hours chart of the LTC/USD pair (data feed from Coinbase).
- The pair must surpass the $125.00 and $128.00 resistance levels to climb further higher in the near term.
Litecoin price is currently consolidating against the US Dollar, while bitcoin is rising. LTC price is likely to face a strong resistance near the $127.00-128.00 area.
Litecoin Price Analysis
This past week, there were sharp losses in litecoin price below the $130.00 support against the US Dollar. The LTC/USD pair broke the $125.00 support and settled well below the 55 simple moving average (4-hours). It opened the doors for more losses below the $120.00 support area. The price broke the $115.00 level and traded close to the $110.00 support level. A swing low was formed near $111.19 and the price is currently correcting higher.
It broke the $115.00 resistance plus the 23.6% Fib retracement level of the last drop from the $136.98 high to $111.19 low. However, there are many hurdles on the upside near $125.00 and $128.00. An immediate resistance is near the $124.00 level and the 55 simple moving average (4-hours). The 50% Fib retracement level of the last drop from the $136.98 high to $111.19 low is also near the $124.00 area.
Above $124.00 and $125.00, there is a crucial bearish trend line forming with resistance near $127.50 on the 4-hours chart of the LTC/USD pair. The trend line coincides with the 61.8% Fib retracement level of the last drop from the $136.98 high to $111.19 low is also near the $124.00 area. Therefore, a successful close above the $128.00 resistance is needed for an upside acceleration in the near term.
If litecoin price fails to climb above the $124.00, $125.00 and $128.00 resistance levels, it could decline again. An immediate support is near the $118.00 level, below which there is a risk of more losses below the $115.00 support area.

Looking at the chart, litecoin price is clearly facing a lot of hurdles near $125.00, $128.00, and the 55 simple moving average (4-hours). Once the bulls clear these hurdles, there are chances of a fresh increase towards $135.00 or $140.00 in the near term.
Technical indicators
4 hours MACD – The MACD for LTC/USD is struggling to gain momentum in the bullish zone.
4 hours RSI (Relative Strength Index) – The RSI for LTC/USD is currently flat below the 50 level.
Key Support Levels – $118.00 and $115.00.
Key Resistance Levels – $125.00 and $128.00.


Leave a Reply
You must be logged in to post a comment.