- Litecoin price failed once again to surpass the main $144.90 resistance area against the US Dollar.
- LTC price declined recently and broke the $140.00 and $132.50 support levels.
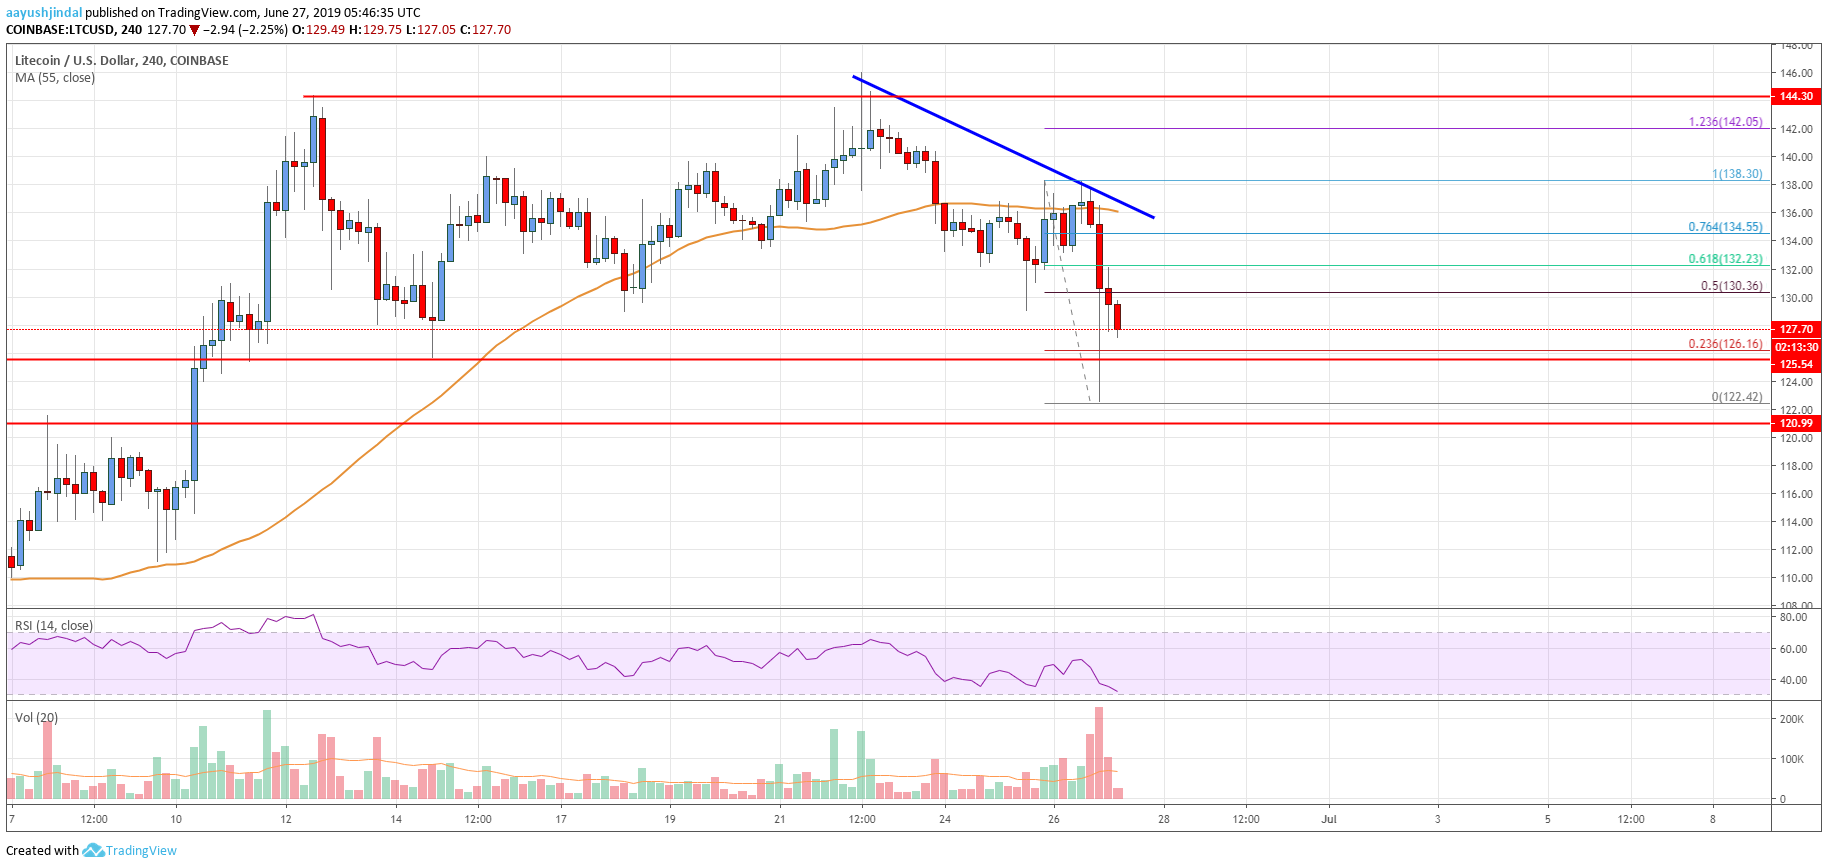
- There is a major bearish trend line forming with resistance near $134.60 on the 4-hours chart of the LTC/USD pair (data feed from Coinbase).
- The pair is currently approaching the key supports near the $125.50 and $121.00 levels.
Litecoin price is struggling to climb higher against the US Dollar, while bitcoin is surging. LTC price must stay above the $125.50 support to avoid a downside break in the near term.
Litecoin Price Analysis
Recently, litecoin price made another attempt to clear the $144.90 resistance area against the US Dollar. However, the LTC/USD pair failed to gain momentum above $145.00 and topped near $145.20. As a result, there was a sharp decline below the $140.00 and $138.00 levels. The price even settled below the $135.00 level and the 55 simple moving average (4-hours).
It opened the doors for more losses below the $132.50 support level. Finally, there was a spike below the $130.00 support and the price traded as low as $122.42. It is currently correcting higher above $125.50 and the 23.6% Fib retracement level of the recent decline from the $138.30 high to $122.42 low. However, it seems like the price is struggling to climb above the $130.00 level.
The 50% Fib retracement level of the recent decline from the $138.30 high to $122.42 low is also acting as a resistance. Moreover, there is a major bearish trend line forming with resistance near $134.60 on the 4-hours chart of the LTC/USD pair. The 55 simple moving average (4-hours) is also near the $135.00 level.
Therefore, the price is facing a lot of hurdles near $130.00 and $135.00. A successful close above $135.00 and the 55 simple moving average (4-hours) is needed for a fresh increase. If the price fails to climb above $130.00 or $135.00, it could continue to decline. An immediate support is near the $125.50 level. If there are more losses, the price may even test the $120.00 and $121.00 support levels.

Looking at the chart, litecoin price is trading with a bearish bias below $130.00 and the 55 simple moving average (4-hours). As long as sellers remain in action, the price may continue to struggle below $135.00. On the downside, the $120.00 support holds the key for more losses.
Technical indicators
4 hours MACD – The MACD for LTC/USD is gaining momentum in the bearish zone.
4 hours RSI (Relative Strength Index) – The RSI for LTC/USD is currently well below the 40 level.
Key Support Levels – $125.50 and $120.00.
Key Resistance Levels – $130.00 and $135.00.


Leave a Reply
You must be logged in to post a comment.