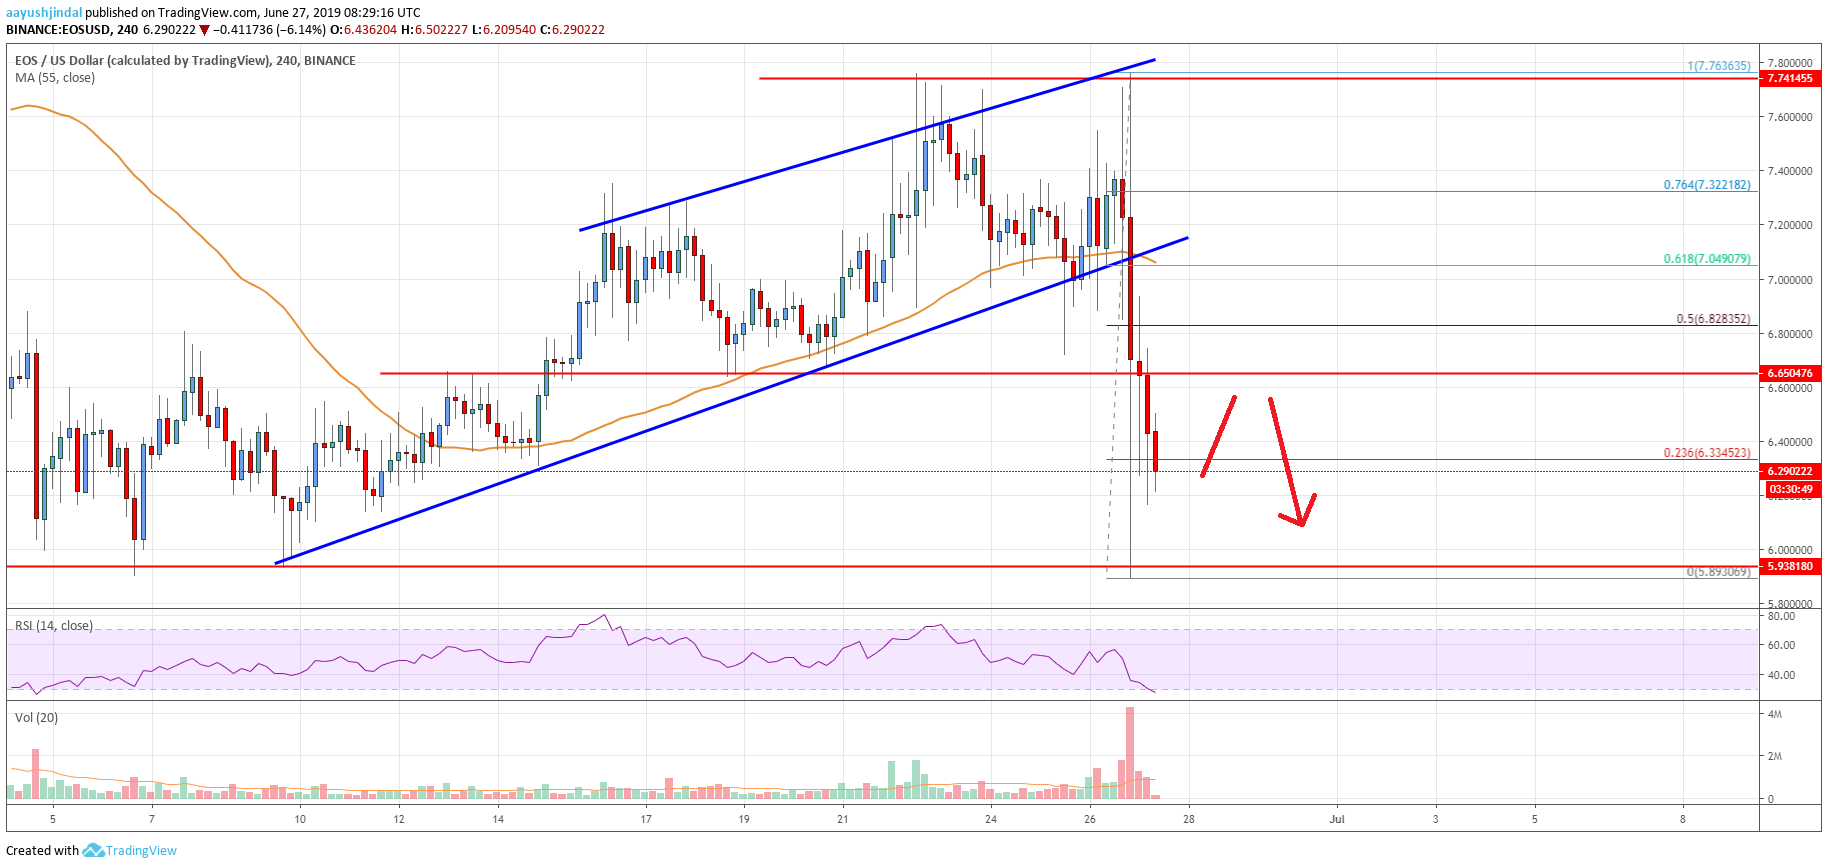
- EOS price failed to break the main $7.750 resistance level and declined sharply against the US Dollar.
- The price broke a few important support levels such as $7.200 and $6.650.
- There was a break below a crucial bullish trend line with support near $7.050 on the 4-hours chart of the EOS/USD pair (data feed from Binance).
- The pair is currently declining and it seems like it could continue to accelerate below the $6.400 level.
EOS price is currently under a lot of pressure against the US Dollar and bitcoin. The price is likely to accelerate decline and it may even revisit the $5.900 support area.
EOS Price Analysis
After a strong rally, there was a sharp downward move in bitcoin, Ethereum, ripple, litecoin and EOS against the US Dollar. Earlier, EOS price climbed towards the $7.750 resistance level, where sellers protected more gains. The price failed to break the $7.750 resistance and recently started a major decline. There was a break below the $7.400 and $7.200 support levels to enter a bearish zone.
Moreover, there was a break below a crucial bullish trend line with support near $7.050 on the 4-hours chart of the EOS/USD pair. The pair settled below the $7.000 support and the 55 simple moving average (4-hours). It opened the doors for more losses below the $6.600 and $6.500 support levels. The price spiked below the $6.000 level and a swing low was formed at $5.890.
Later, the price corrected higher and traded above the 23.6% Fib retracement level of the downward move from the $7.760 high to $5.890 low. However, the $6.500 and $6.650 levels are currently acting as strong resistances. The next key resistance is near the $6.820 level. The 50% Fib retracement level of the downward move from the $7.760 high to $5.890 low is also near the $6.800 level.
If there is an upside break above $6.800, the price could trade towards the $7.000 level and the 55 simple moving average (4-hours). Conversely, if there is no upside break, the price could continue to decline. An initial support is near the $6.100 level, below which there is a risk of more losses below $6.000.

Looking at the chart, EOS price could is clearly facing a strong resistance near the $6.500 and $6.650 levels. If the price continues to struggle, it could slide below $6.100. If the bulls fail near $6.000, the price may even slide below $5.800.
Technical indicators
Hourly MACD – The MACD for EOS/USD is currently gaining momentum in the bearish zone.
Hourly RSI (Relative Strength Index) – The RSI is currently just below the 40 level, with a bearish angle.
Major Support Levels – $6.100 and $5.900.
Major Resistance Levels – $6.650 and $6.800.


Leave a Reply
You must be logged in to post a comment.