- Litecoin price stayed above the $120.00 and $130.00 support levels against the US Dollar.
- LTC price recently traded higher and broke the $135.00 and $138.00 resistance levels.
- There is a major breakout pattern forming with support near the $134.50 level on the 4-hours chart of the LTC/USD pair (data feed from Coinbase).
- The pair is likely to make the next move either above $140.00 and $150.00 or declined below $130.00.
Litecoin price is showing a few positive signs against the US Dollar, while correcting vs bitcoin. LTC price is likely to rally significantly once it clears the $140.00 resistance area.
Litecoin Price Analysis
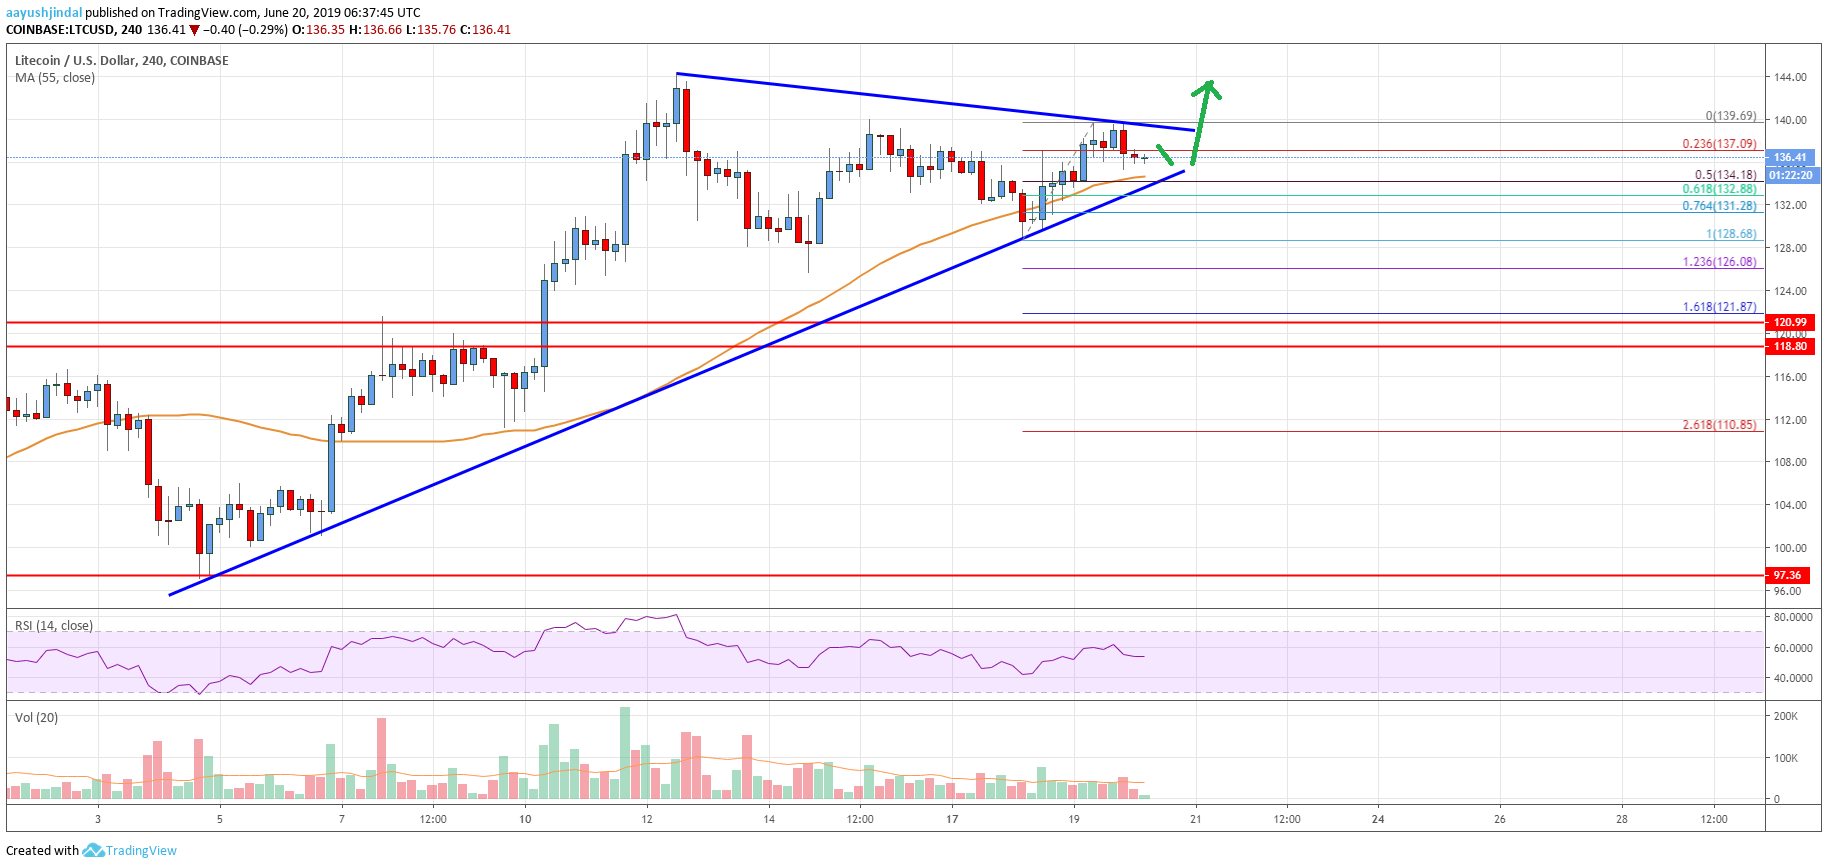
Recently, litecoin price declined a few points below the $130.00 support against the US Dollar. The LTC/USD pair traded as low as $128.68 and recently started a decent upward move. It broke the $132.00 and $134.00 level to remain in a positive zone. The price even traded above the $136.00 level and settled above the 55 simple moving average (4-hours).
However, the price failed to surpass the $140.00 resistance and recently formed a swing high at $139.69. It is currently correcting lower below the $138.00 level, and the 23.6% Fib retracement level of the upward move from the $28.68 low to $139.69 high. However, there is a strong support forming on the downside near the $134.40 level.
The 50% Fib retracement level of the upward move from the $28.68 low to $139.69 high is also near the $134.20 level. Moreover, the 55 simple moving average (4-hours) is positioned near $134.20. Finally, there is a major breakout pattern forming with support near the $134.50 level on the 4-hours chart of the LTC/USD pair. Therefore, the pair is likely to remain supported near the $134.20 and $134.50 levels.
If there is a downside break below $134.00, the price could revisit the $128.68 swing low. An intermediate support is near $131.20 and the 76.4% Fib retracement level of the upward move from the $28.68 low to $139.69 high. On the flip side, if there is an upside break above the $140.00 barrier, the price is likely to accelerate higher. The next key resistance is near the $145.00, above which it could climb above $150.00.

Looking at the chart, litecoin price is clearly trading with a positive bias above the $134.00 level and the 55 SMA. As long as the price is above the 55 SMA, there are chances of an upside break towards $160.00.
Technical indicators
4 hours MACD – The MACD for LTC/USD is slowly losing momentum in the bullish zone.
4 hours RSI (Relative Strength Index) – The RSI for LTC/USD is currently correcting lower towards the 52 level.
Key Support Levels – $134.00 and $130.00.
Key Resistance Levels – $140.00 and $145.00.


Leave a Reply
You must be logged in to post a comment.