- Litecoin price started a strong rise after forming a support base near the $110.00 level against the US Dollar.
- LTC price gained bullish momentum after it broke the key $122.00 resistance area.
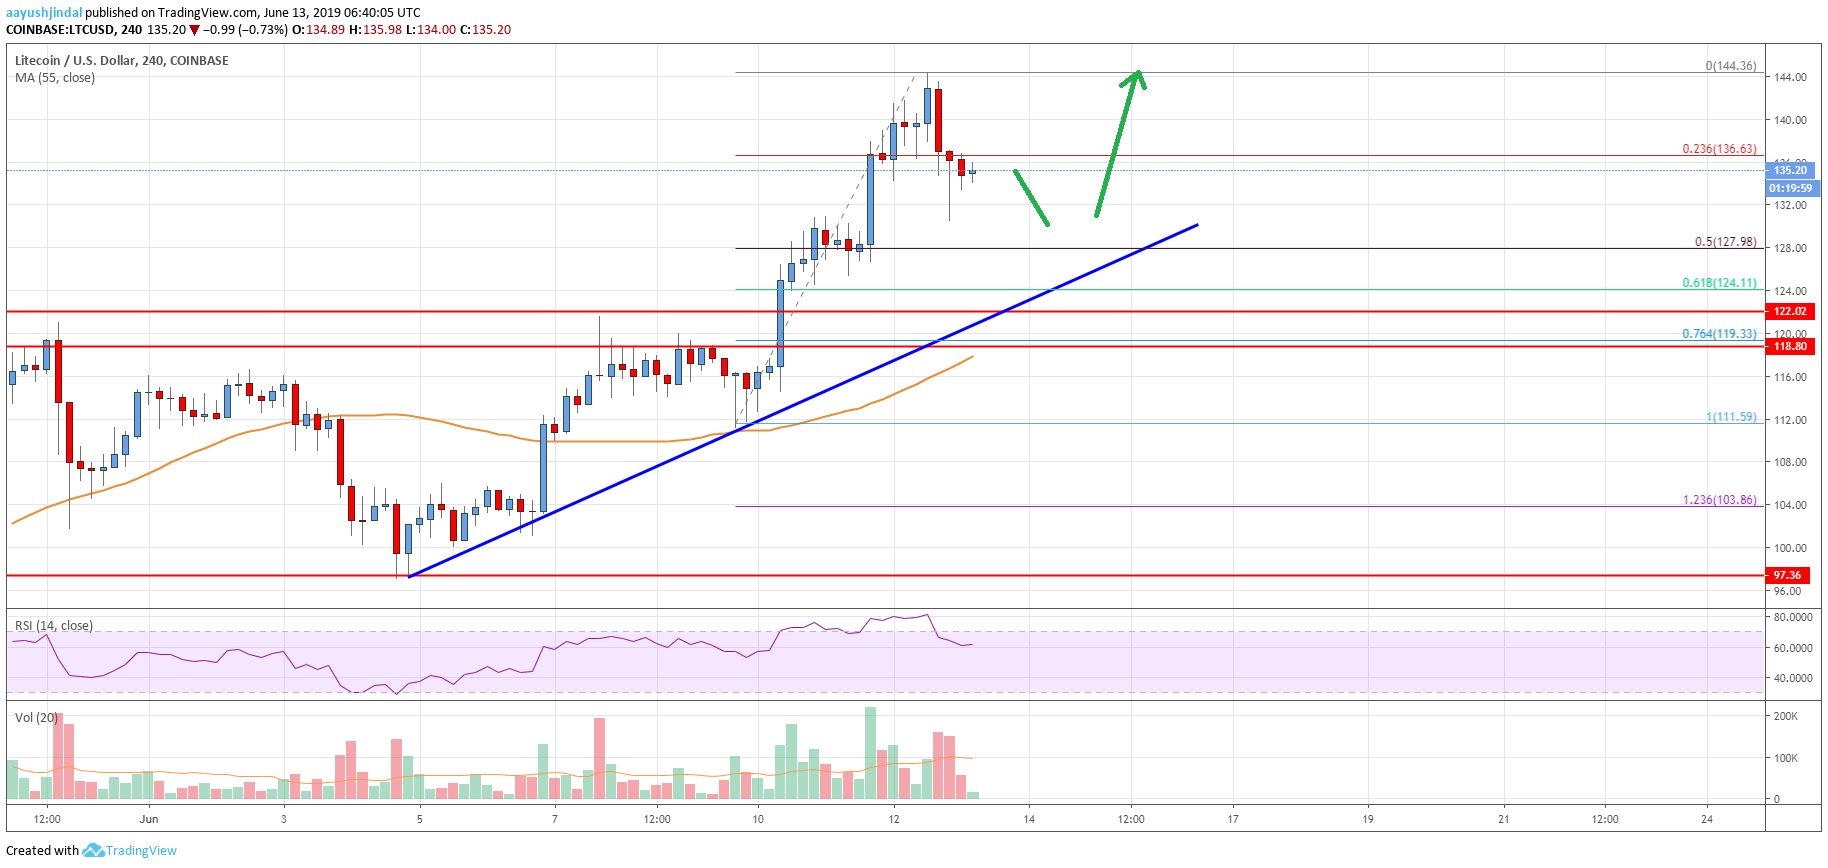
- There is a major bullish trend line forming with support at $126.00 on the 4-hours chart of the LTC/USD pair (data feed from Coinbase).
- The pair is likely to break the $145.00 and $150.00 resistance levels to trade towards $160.00.
Litecoin price traded to a new monthly high above $140.00 against the US Dollar, and rallied vs bitcoin. LTC price is placed in an uptrend and it is likely to accelerate above $150.00 in the coming sessions.
Litecoin Price Analysis
Recently, litecoin price found a strong buying interest above $110.00 against the US Dollar. The LTC/USD pair formed a swing low near $111.59 and recently started a strong rally. It broke the $115.00 and $120.00 resistance levels to move into a positive zone. Moreover, the price settled above $120.00 and the simple moving average (4-hours). The bulls gained momentum after it broke the key $122.00 resistance area.
As a result, the price surged higher above the $130.00 and $140.00 levels. It even broke the $142.00 level and traded to a new monthly high at $144.36. Recently, it started a downside correction below the $140.00 level. The price traded below the 23.6% Fib retracement level of the upward move from the $111.59 low to $144.36 high.
However, there are many supports on the downside near $132.00 and $130.00. The next main support is near the $128.50 level. It coincides with the 50% Fib retracement level of the upward move from the $111.59 low to $144.36 high. Moreover, there is a major bullish trend line forming with support at $126.00 on the 4-hours chart of the LTC/USD pair.
Finally, the 61.8% Fib retracement level of the upward move from the $111.59 low to $144.36 high is near the $124.11 level. To move into a bearish zone, the price must settle below $120.00. On the upside, an initial resistance is near the $142.00 and $144.00 levels. If there is an upside break above $144.00, the price is likely to accelerate above the $150.00 barrier.

Looking at the chart, litecoin price is clearly trading in a strong uptrend above the $130.00 and $122.00 support levels. Therefore, there are high chances of more gains above the $144.00 and $150.00 levels in the coming sessions.
Technical indicators
4 hours MACD – The MACD for LTC/USD is slowly losing momentum in the bullish zone, but there are still positive signs.
4 hours RSI (Relative Strength Index) – The RSI for LTC/USD is currently correcting towards the 55 level.
Key Support Levels – $126.00 and $122.00.
Key Resistance Levels – $144.00 and $150.00.


Leave a Reply
You must be logged in to post a comment.