- Litecoin price corrected lower after trading as high as $131.93 against the US Dollar.
- LTC price declined below the $115.00 level, but the $110.00 support zone prevented declines.
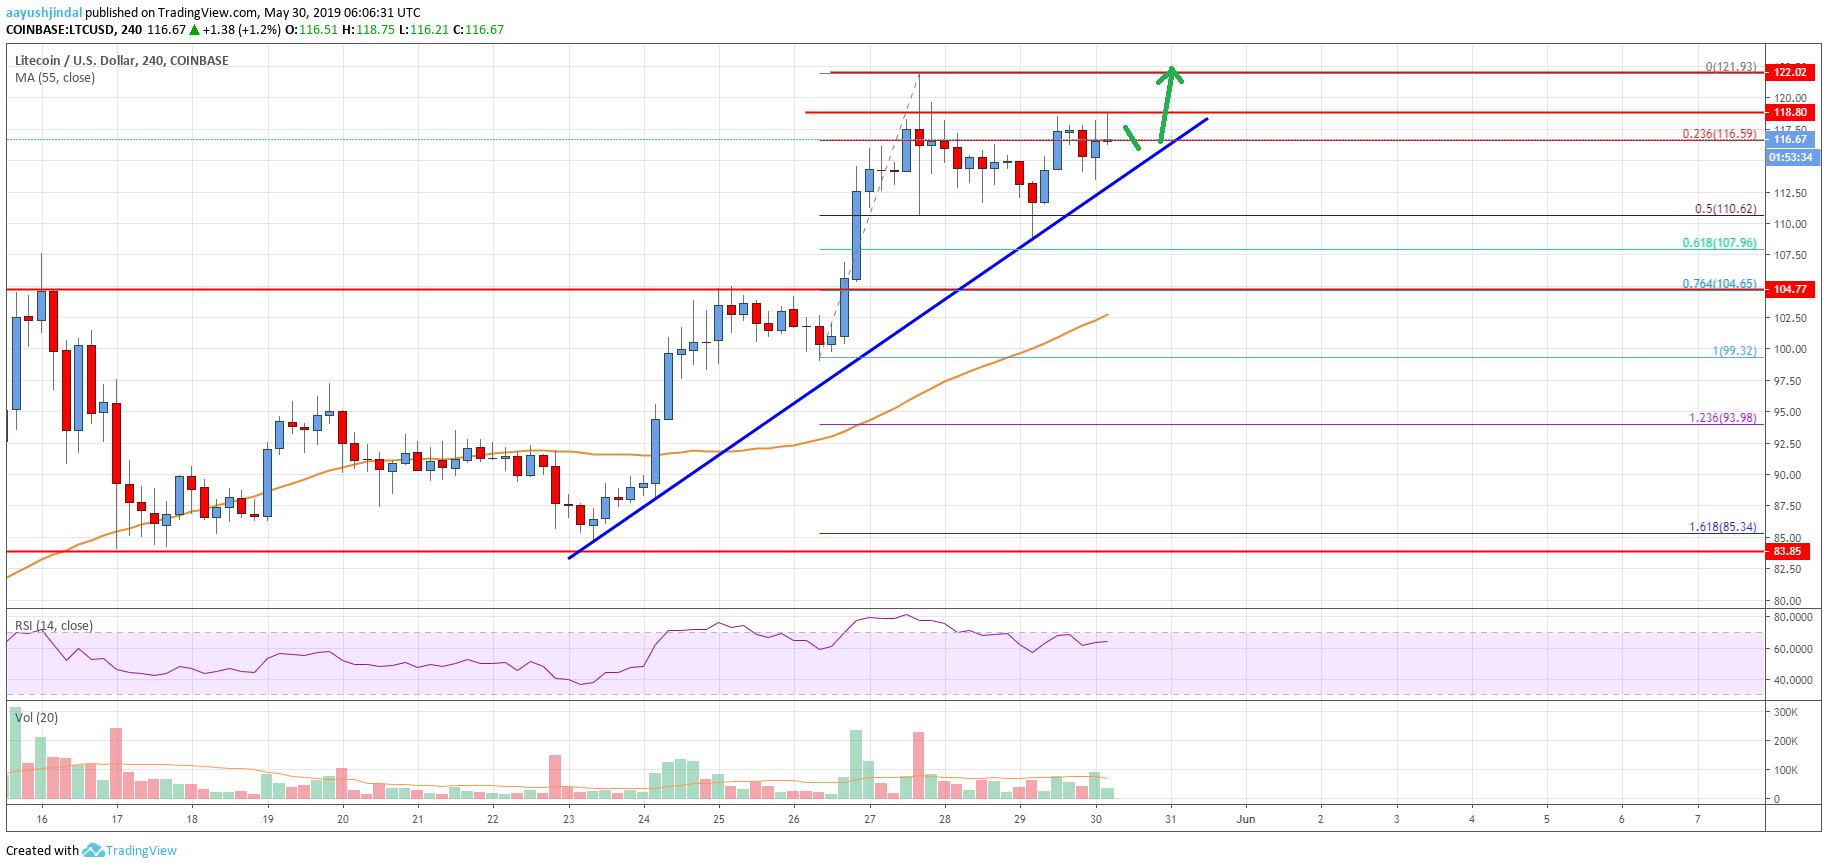
- There is a major bullish trend line forming with support at $114.00 on the 4-hours chart of the LTC/USD pair (data feed from Coinbase).
- The pair is likely to break the $120.00 and $122.00 resistance levels to trade towards $135.00.
Litecoin price remains in a strong uptrend above $100.00 against the US Dollar, similar to bitcoin. LTC price is likely to accelerate above $120.00 and it could even test the $135.00 level.
Litecoin Price Analysis
Earlier this week, there was a steady rise in litecoin price above the $100.00 barrier against the US Dollar. The LTC/USD pair traded above the $110.00 and $115.00 resistance levels. There was also a close above the $110.00 level and the 55 simple moving average (4-hours). The price traded to a new monthly high above $120.00 at $121.93. Recently, it started a downside correction below $115.00 and the 23.6% Fib retracement level of the upward move from the $99.32 low to $121.93 high.
However, the decline was protected by the $110.00 support. Besides, the 50% Fib retracement level of the upward move from the $99.32 low to $121.93 high acted as a support. Moreover, there is a major bullish trend line forming with support at $114.00 on the 4-hours chart of the LTC/USD pair. The pair is currently moving higher and is trading above the $115.00 level. An immediate resistance is near the $118.80 level, above which the price could accelerate above the $120.00 resistance area.
The main hurdle is near $122.00, above which the price is likely to accelerate above the $125.00 level. The next key resistances are near $132.00 and $135.00. Conversely, if there is a downside correction, the price might find support near the $115.00 and $114.00 level. If there is a downside break below the trend line, the price might revisit the key $110.00 support area.

Looking at the chart, litecoin price is clearly trading with a positive bias above the $110.00 and $115.00 support levels. Therefore, there are chances of more gains above the $122.00 resistance. If the bulls remain in action, the price is likely to test $135.00. Only a close below the $110.00 support level could start an extended downside correction towards the $100.00 or $95.00 support area.
Technical indicators
4 hours MACD – The MACD for LTC/USD is currently gaining momentum in the bullish zone, with positive signs.
4 hours RSI (Relative Strength Index) – The RSI for LTC/USD is currently well above the 50 level.
Key Support Levels – $114.00 and $110.00.
Key Resistance Levels – $122.00 and $130.00.


Leave a Reply
You must be logged in to post a comment.