- Litecoin price is recovering nicely from the monthly low of $35.85 against the US Dollar.
- LTC price is up around 10% and it even climbed above the $40.00 resistance area.
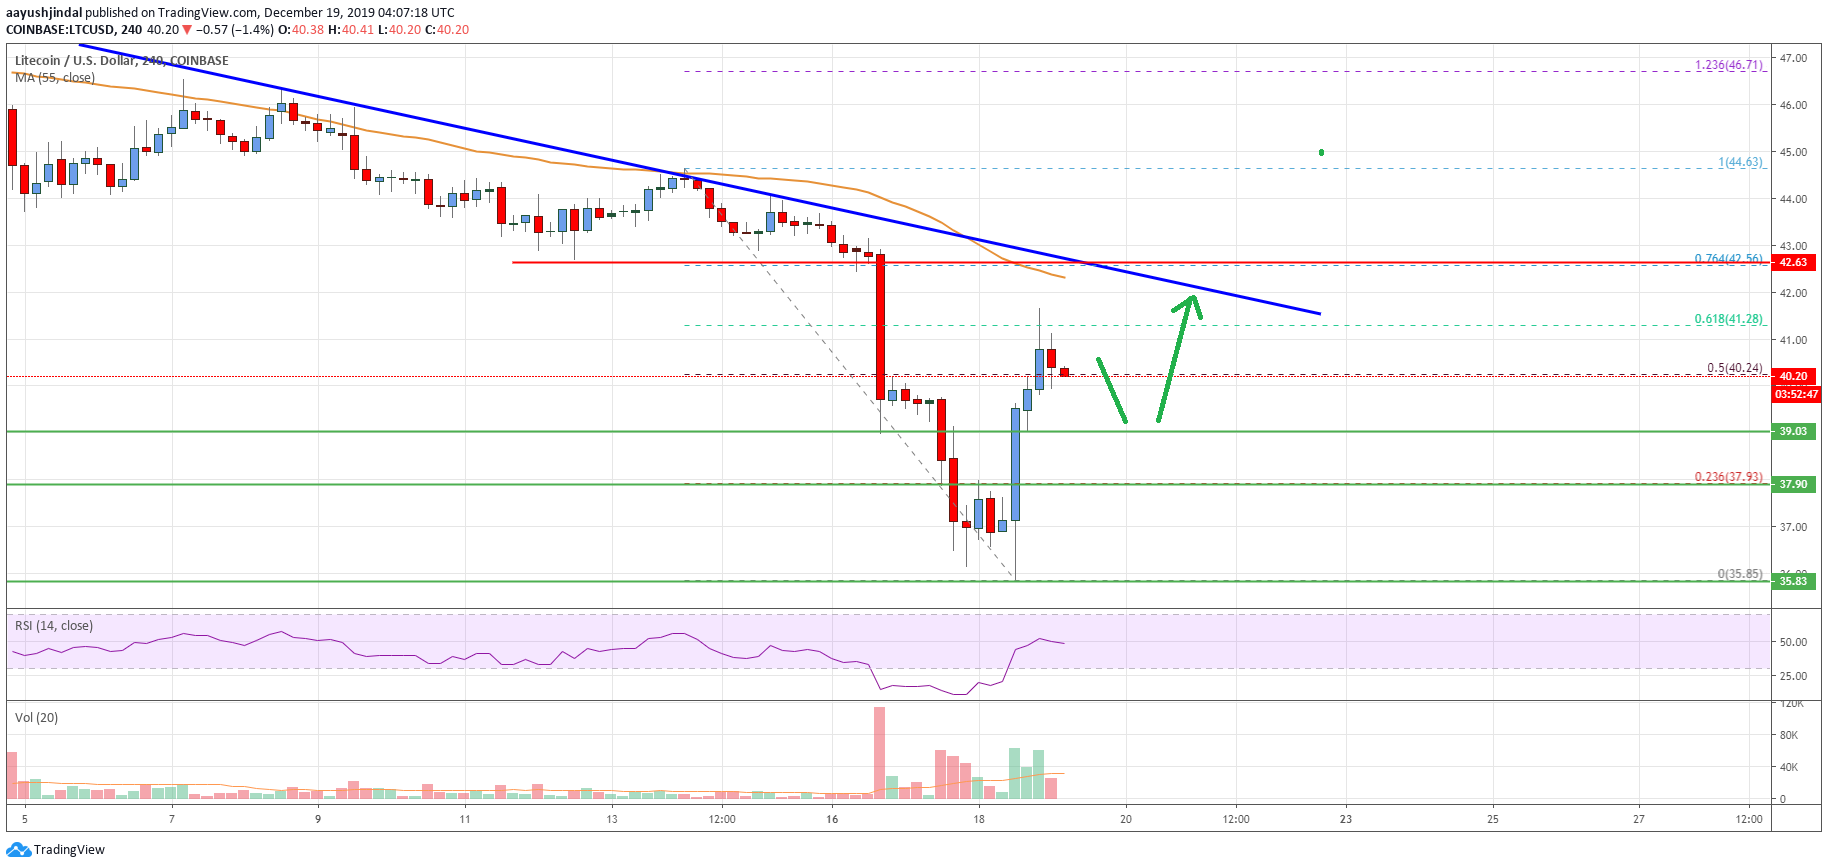
- There is a crucial bearish trend line forming with resistance near $42.20 on the 4-hours chart of the LTC/USD pair (data feed from Coinbase).
- The pair could consolidate in the short term before it revisits the $42.00 resistance area.
Litecoin price is showing a few positive signs against the US Dollar, similar to bitcoin. LTC price could accelerate its recovery once it clears the $42.00 resistance area.
Litecoin Price Analysis
In the past 2-3 sessions, there was a nice recovery in bitcoin, Ethereum, ripple and litecoin against the US Dollar. Earlier, LTC price traded to a new monthly low near the $35.85 level.
Later, the price started a strong recovery and traded above the $37.00 and $38.00 resistance levels. Moreover, there was a break above the $40.00 resistance level.
Finally, the price rallied above the 50% Fib retracement level of the downward move from the $44.63 high to $35.85 low. It opened the doors for more gains above $41.00, but the price remained well below the 55 simple moving average (4-hours).
Besides, the 61.8% Fib retracement level of the downward move from the $44.63 high to $35.85 low acted as a strong resistance. More importantly, there is a crucial bearish trend line forming with resistance near $42.20 on the 4-hours chart of the LTC/USD pair.
The trend line resistance at $42.20 is also close to the 55 simple moving average (4-hours). Therefore, a clear break above the $42.00 and $42.20 resistance levels is needed for a trend reversal in litecoin in the medium term.
The next major resistance is near the $44.60 level, above which it could test the 1.236 Fib extension level of the downward move from the $44.63 high to $35.85 low at $46.71.
Conversely, the price could struggle to recover above the $42.00 and $42.20 resistance levels. In the mentioned case, the price might decline towards the $39.00 and $38.00 support levels. The main support is still near the $36.00 area, below which there is an open space up to $32.00.
Looking at the chart, litecoin price is showing a few positive signs above $40.00, similar to bitcoin above $7,000. However, the price must gain strength above $40.00 and $42.00 to continue higher in the near term.
Technical indicators
4 hours MACD – The MACD for LTC/USD is slowly losing momentum in the bearish zone.
4 hours RSI (Relative Strength Index) – The RSI for LTC/USD is now close to the 50 level.
Key Support Levels – $39.00 and $38.00.
Key Resistance Levels – $42.00 and $42.20.
