
- Litecoin price started a strong surge above the $80.00 and $82.00 resistance levels against the US Dollar.
- LTC price traded close to the $95.00 level and settled below the 55 simple moving average (4-hours).
- There was a break above a key bearish trend line with resistance near $82.10 on the 4-hours chart of the LTC/USD pair (data feed from Coinbase).
- The pair is now facing a strong resistance near the $92.00 and $94.00 levels.
Litecoin price is up over 10% and it tested the $95.00 zone against the US Dollar, while bitcoin is above $21K. LTC price could correct lower if it struggles near $92.50 and $94.50.
Litecoin Price Analysis
This week, there was a sharp increase in bitcoin, Ethereum, ripple, and litecoin against the US Dollar. Earlier, LTC price formed a strong support base near the $78.30 level before starting the recent increase.
There was a break above the $82.00 resistance level and the price settled nicely above the 55 simple moving average (4-hours). During the rise, there was a break above a key bearish trend line with resistance near $82.10 on the 4-hours chart of the LTC/USD pair.
There was also a break below the $88.00 level and the price spiked above the main $92.50 resistance zone. A high is formed near the $94.53 level and the price is currently consolidating gains.
An initial support on the downside is near the $90.70 level. It is close to the 23.6% Fib retracement level of the recent rally from the $78.30 low to $94.53 high. If there are more downsides, the price could correct lower towards the $86.50 and $85.50 levels.
The 50% Fib retracement level of the recent rally from the $78.30 low to $94.53 high is also near the $86.40 level. Conversely, the price could continue to move up above the $92.50 resistance.
The next major resistance is near the $94.50 and $95.00 levels. A successful close above the $95.00 level may perhaps spark a move towards the $100.00 level.
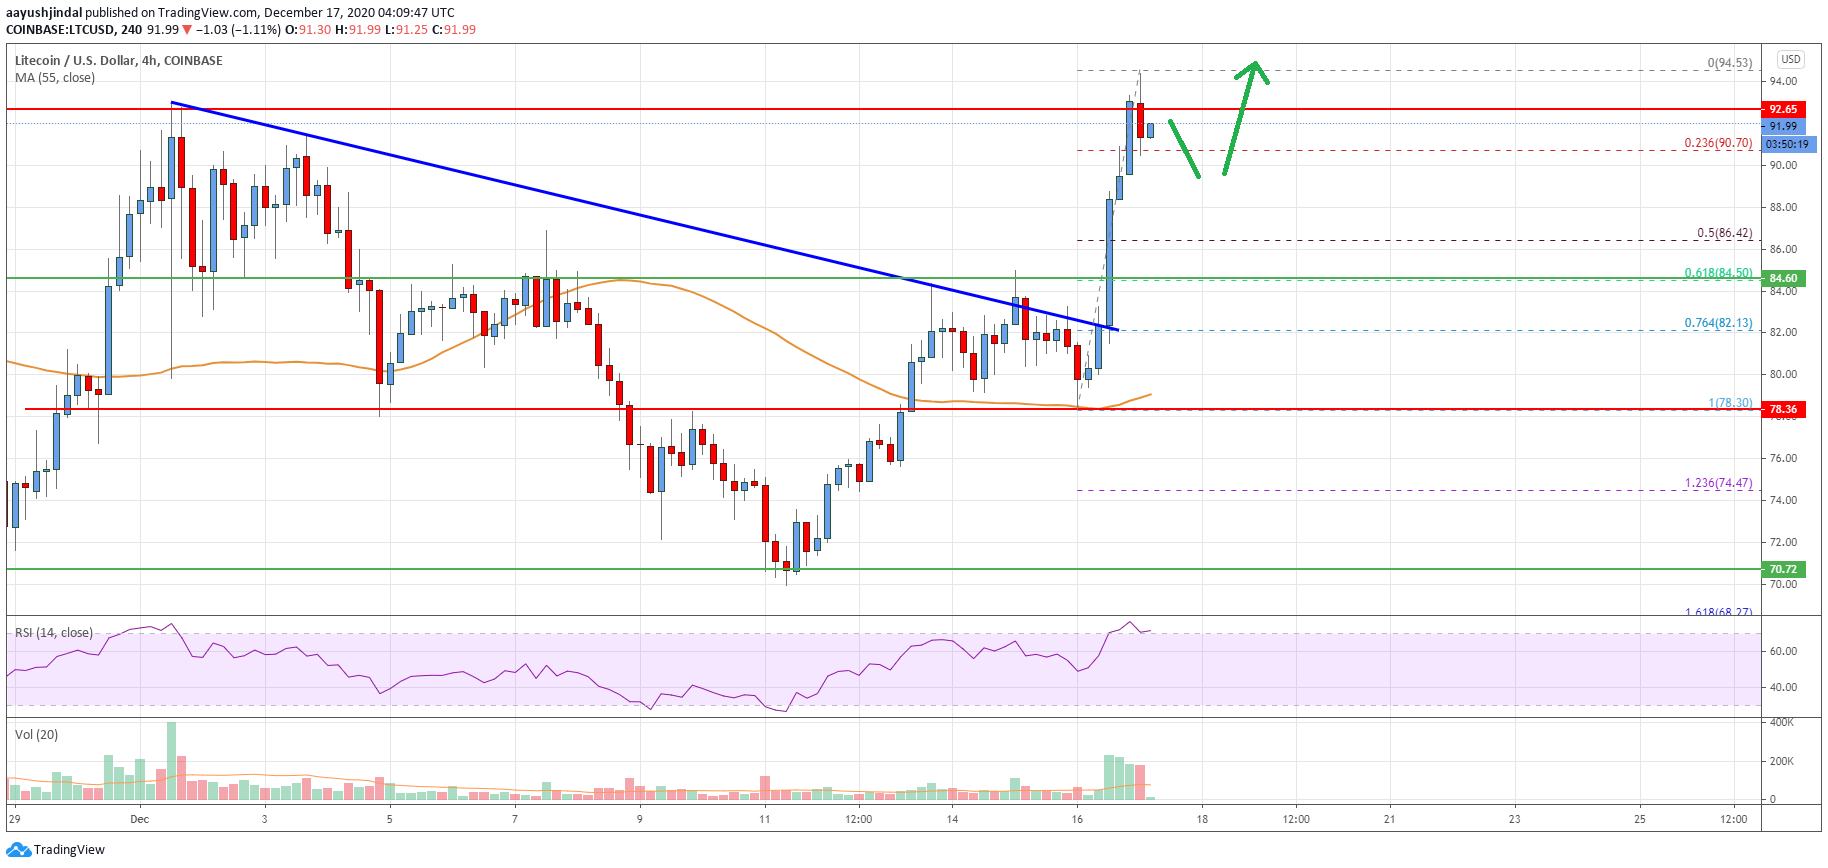
Looking at the chart, litecoin price is clearly showing bullish signs below $90.00 and the 55 simple moving average (4-hours). Overall, the price is now facing a strong resistance near the $92.00 and $94.00 levels, but it remains well supported for more gains.
Technical indicators
4 hours MACD – The MACD for LTC/USD is currently losing momentum in the bullish zone.
4 hours RSI (Relative Strength Index) – The RSI for LTC/USD is correcting lower from the 70 level.
Key Support Levels – $90.00 and $86.50.
Key Resistance Levels – $92.50 and $95.00.


Leave a Reply
You must be logged in to post a comment.