- Litecoin started a recovery wave from the $60 level against the US Dollar.
- LTC price is now trading below $65 and the 55 simple moving average (4-hours).
- There was a break below a major bullish trend line with support near $64 on the 4-hours chart of the LTC/USD pair (data feed from Coinbase).
- The pair could accelerate lower if there is a clear move below the $60 support.
Litecoin price is losing pace below $65 against the US Dollar, similar to bitcoin. LTC price could continue to move down towards the $50 support.
Litecoin Price Analysis
In the past few days, there were range moves in bitcoin, ethereum, ripple, and litecoin against the US Dollar. Earlier, LTC formed a base above the $60 level and started a recovery wave.
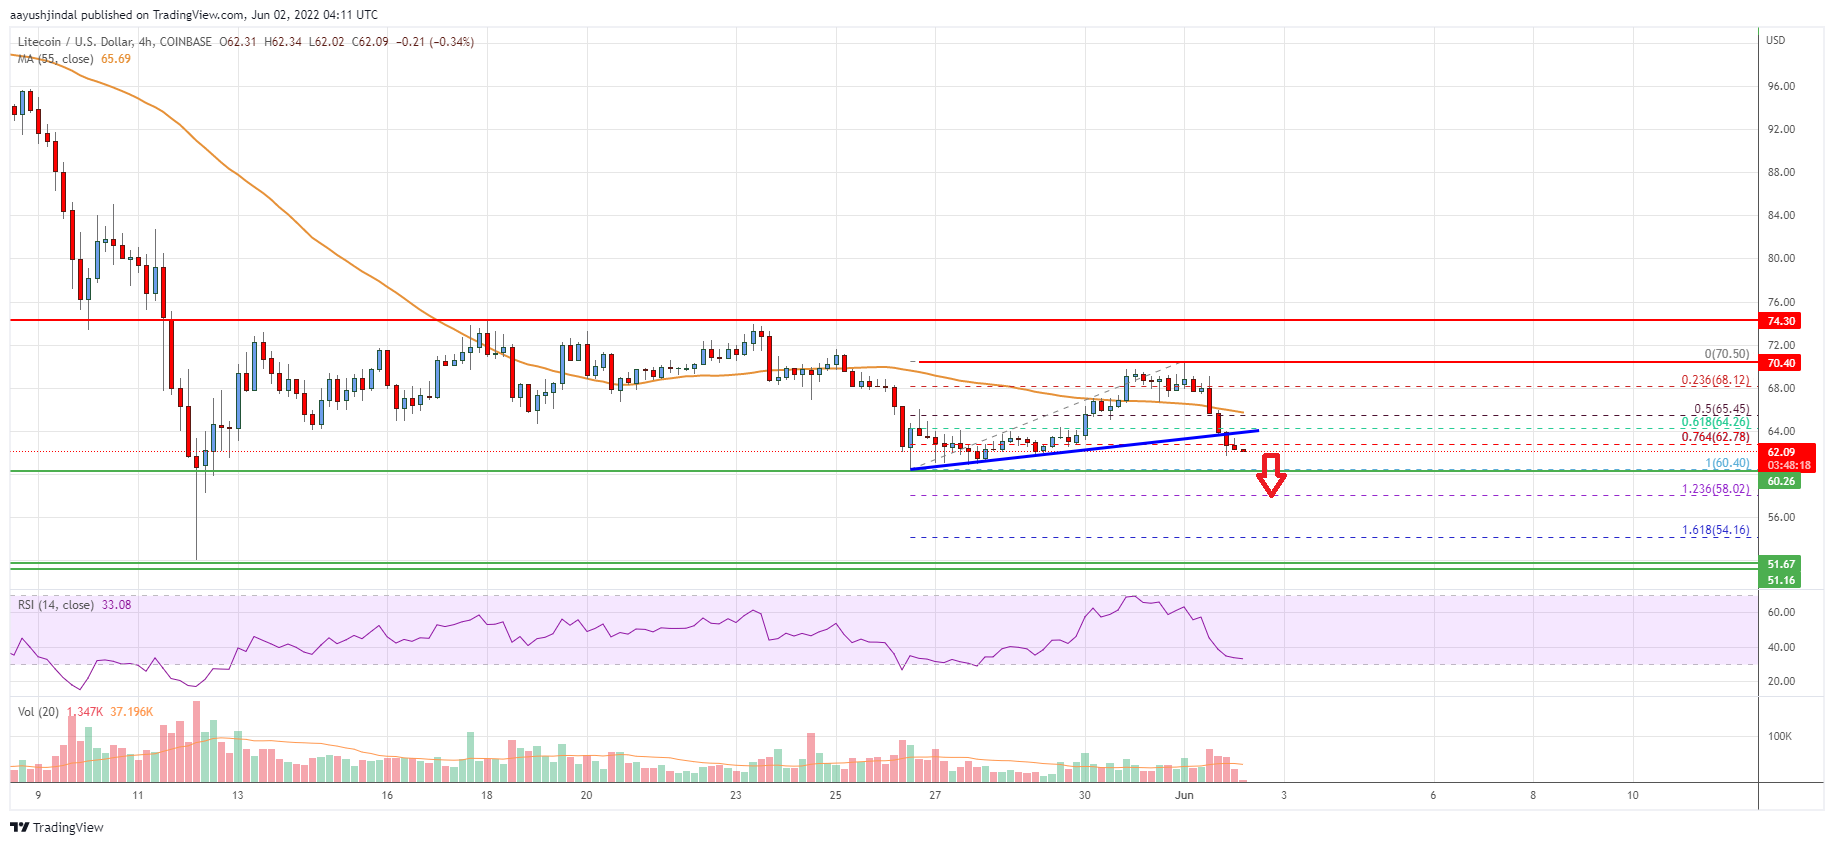
There was a move above the $55 and $68 resistance levels. However, the price failed to clear the $70 and $72 resistance levels. A high was formed near $70.50 and the price started a fresh decline. There was a move below the 50% Fib retracement level of the upward move from the $60.40 swing low to $70.50 high.
Besides, there was a break below a major bullish trend line with support near $64 on the 4-hours chart of the LTC/USD pair. The price is now trading below $65 and the 55 simple moving average (4-hours).
It also broke the 76.4% Fib retracement level of the upward move from the $60.40 swing low to $70.50 high. On the downside, an immediate support is near the $62 level. The next key support is near the $60 level. If there is a downside break below the $60 support, the price could continue to move down towards the $50 level in the near term.
On the upside, the price might face resistance near the $65 level. The first major resistance is near the $70 level. To start a fresh increase, the price must clear $70 and $72.

Looking at the chart, litecoin price is clearly trading below $65 and the 55 simple moving average (4-hours). Overall, the price could accelerate lower if there is a clear move below the $60 support.
Technical indicators
4 hours MACD – The MACD for LTC/USD is now gaining pace in the bearish zone.
4 hours RSI (Relative Strength Index) – The RSI for LTC/USD is now below the 50 level.
Key Support Levels – $60 and $50
Key Resistance Levels – $65 and $70.


Leave a Reply
You must be logged in to post a comment.