- Litecoin price failed to clear the $47.50 level and declined recently against the US Dollar.
- LTC price is now trading below the $45.00 level, with a bearish angle.
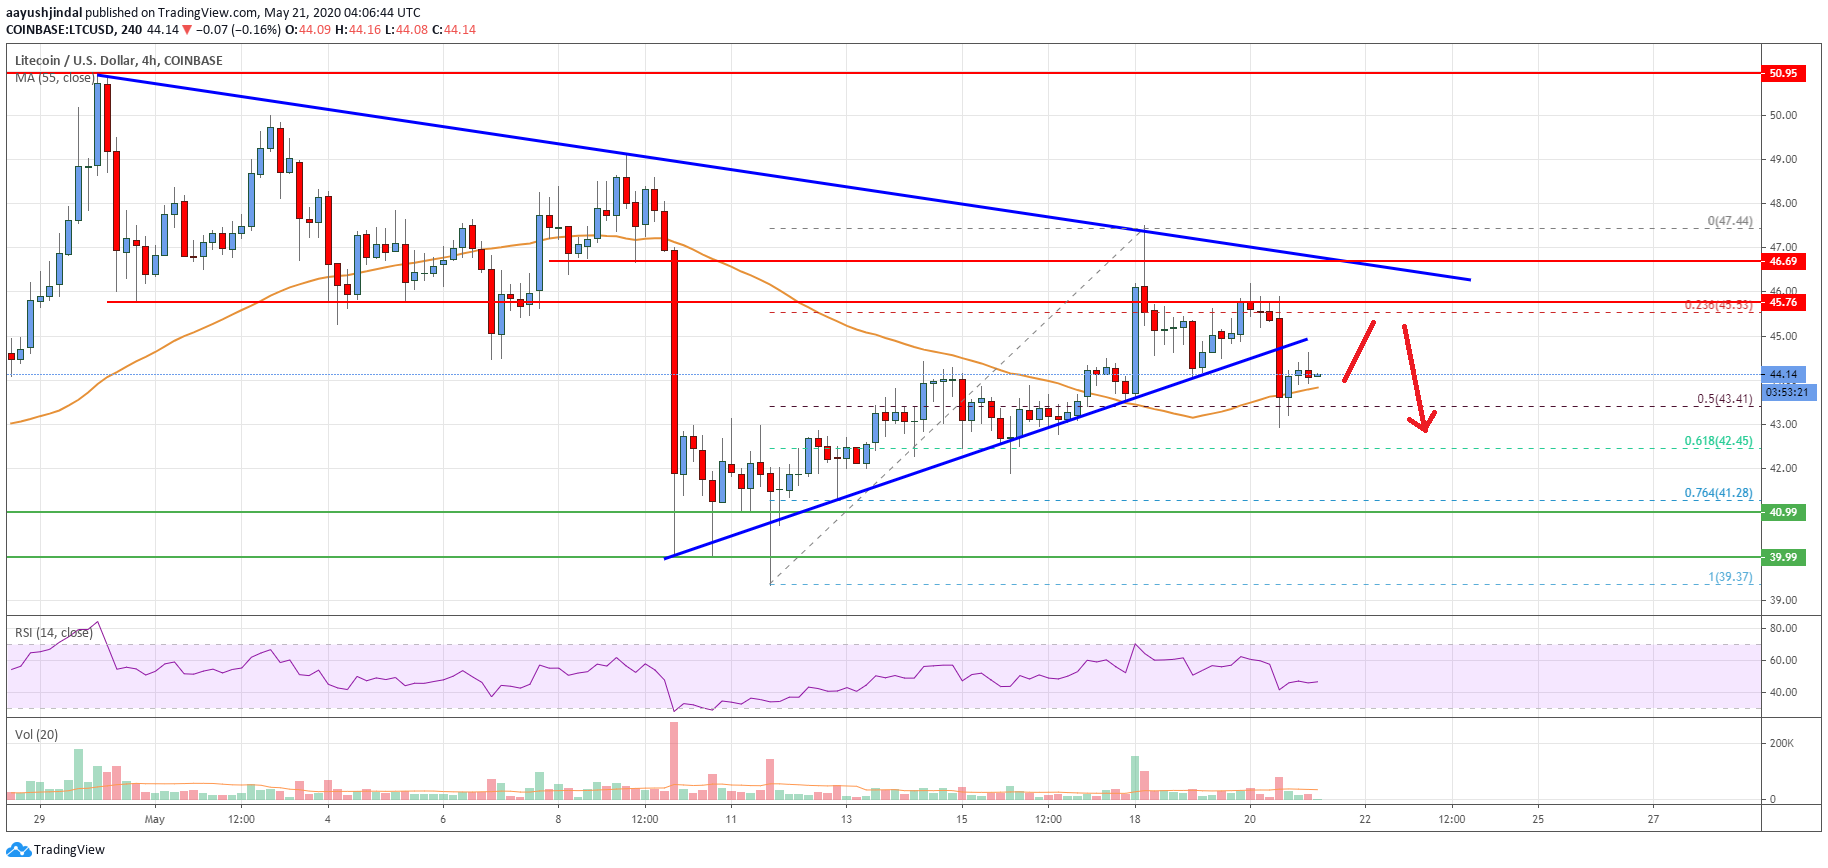
- There is a key bearish trend line forming with resistance near $46.60 on the 4-hours chart of the LTC/USD pair (data feed from Coinbase).
- The pair could correct higher, but it remains at a risk of more losses below $44.00 and $42.00.
Litecoin price is showing signs of another bearish wave against the US Dollar and bitcoin. LTC price must stay above the $40.00 support zone to avoid a major downside reversal.
Litecoin Price Analysis
After a steady rise, there was a fresh decrease in bitcoin, Ethereum, ripple, and litecoin against the US Dollar. Earlier, LTC price gained bullish momentum above the $44.00 and $45.00 levels.
The price even traded above the $46.50 resistance and settled above the 55 simple moving average (4-hours). However, it faced a strong selling interest near the $47.00 and $47.50 levels.
A high was formed near $47.44 and the price recently started a fresh decline. More importantly, there is a key bearish trend line forming with resistance near $46.60 on the 4-hours chart of the LTC/USD pair.
The pair was rejected near the trend line before it declined below $45.00. The price traded below the 23.6% Fib retracement level of the upward move from the $39.37 low to $47.44 high.
Litecoin is now trading near the $44.00 support and the 55 simple moving average (4-hours). It is testing the 50% Fib retracement level of the upward move from the $39.37 low to $47.44 high. If there is a break below the $44.00 level and the 55 SMA, the price could dive towards the $42.00 support.
The main supports are near $41.00 and $40.00, below which there is a risk of a larger bearish wave in the near term. On the upside, the $46.50 and $47.50 levels are important barriers. To move into a positive zone, the price must break the trend line and continue higher towards the $50.00 level.

Looking at the chart, litecoin price is clearly showing a few bearish signs and it remains at a risk of more losses below $44.00 and $42.00. However, the price is likely to find bids near the $40.00 support.
Technical indicators
4 hours MACD – The MACD for LTC/USD is slowly moving into the bearish zone.
4 hours RSI (Relative Strength Index) – The RSI for LTC/USD is now below the 50 level, with a bearish angle.
Key Support Levels – $41.00 and $40.00.
Key Resistance Levels – $46.50 and $47.50.


Leave a Reply
You must be logged in to post a comment.