- Litecoin price is trading nicely above the $75.00 and $75.20 support levels against the US Dollar.
- LTC price recovered above $80.00 and tested the $84.50 resistance area recently.
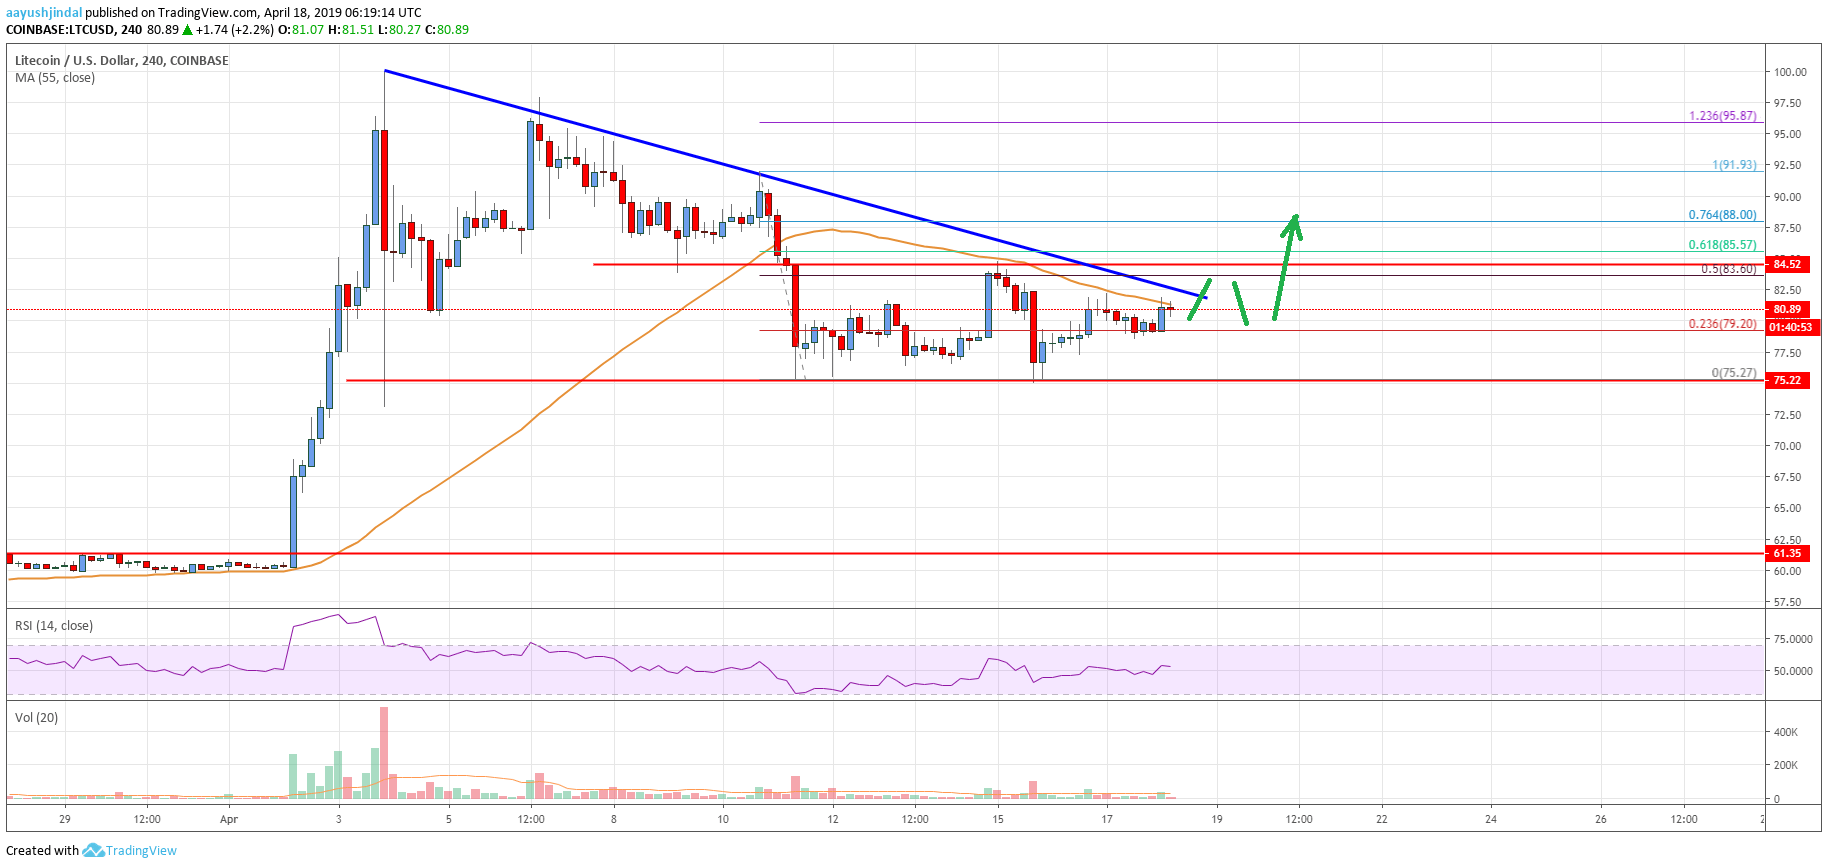
- There is a crucial bearish trend line in place with resistance at $82.50 on the 4-hours chart of the LTC/USD pair (data feed from Coinbase).
- The pair is likely to smash the $82.50 resistance area and rally above the $84.50 resistance.
Litecoin price is positioned nicely above key supports against the US Dollar and bitcoin. LTC could start a strong upward move if it clears the $82.50 and $84.50 resistance levels.
Litecoin Price Analysis
In the past few days, there were swing moves below $84.50 and $85.00 in litecoin price against the US Dollar. The LTC/USD pair declined below the $80.00 level, but the $75.00 and $75.20 support levels prevented additional losses. Sellers made many attempts to push the price below the $75.00 support, but they failed. Recently, the price rebounded above the $79.00 level and the 23.6% Fib retracement level of the last drop from the $91.93 high to $75.27 low.
However, the upward move was capped by the $84.50 resistance and the 55 simple moving average (4-hours). The price also failed near the 50% Fib retracement level of the last drop from the $91.93 high to $75.27 low. Recently, there were positive moves in bitcoin, Ethereum, ripple, EOS, ADA, TRX and other cryptocurrencies. Therefore, there are chances of an upside break in litecoin above the $82.50 resistance. There is also a crucial bearish trend line in place with resistance at $82.50 on the 4-hours chart of the LTC/USD pair.
A clear break above the trend line will most likely set the pace for more gains above $84.00 and $84.50. The next major resistance is near $88.00 and the 76.4% Fib retracement level of the last drop from the $91.93 high to $75.27 low. Above $88.00, the price is likely to accelerate above $91.50 and $94.00 in the coming days.

Looking at the chart, litecoin price seems to be preparing for the next upside break above $82.50 and $84.50. If buyers fail to gain pace above $82.50, there is a risk of a fresh drop to $75.20. Any further losses may trigger an extended correction towards the $71.00 level. On the upside, buyers are likely to take control if there is a close above the $84.50 resistance level.
Technical indicators
4 hours MACD – The MACD for LTC/USD is slowly gaining pace in the bullish zone, with a negative bias.
4 hours RSI (Relative Strength Index) – The RSI for LTC/USD is now placed nicely above the 50 level.
Key Support Levels – $77.50 and $75.20.
Key Resistance Levels – $82.50 and $84.50.


Leave a Reply
You must be logged in to post a comment.